During the SQLRally conference in Copenhagen/Denmark, Brent Ozar (Blog, Twitter) and I had a very interesting conversation regarding Statistics on UNIQUEIDENTIFER columns. It seems that SQL Server shows some very nasty behavior here. Let’s have a look.
The repro
To show you the behavior we have complained about, I created a new database with the following simple table definition, where I enforced the primary key constraint on a UNIQUEIDENTIFER column. This means that SQL Server generates a unique Clustered Index in the background, and the Clustered Index itself has an underlying Statistics object that describes the data distribution in that column. Of course, the data distribution is linear, because every value in the UNIQUEIDENTIFIER column is by its nature unique.
-- Create a new table with a UNIQUEIDENTIFIER column as primary key.
-- SQL Server will enforce the primary key constraint through unique clustered index in the background.
CREATE TABLE CustomersTableGuid
(
ID UNIQUEIDENTIFIER NOT NULL PRIMARY KEY,
FirstName VARCHAR(50),
LastName VARCHAR(50)
)
GO
In the next step I have inserted 1 million rows into that table.
-- Insert 1 million records DECLARE @i INT = 0 WHILE (@iAnd now we update our statistics on that table with a FULLSCAN. A FULLSCAN means that SQL Server scans the complete underlying data to update the statistics object.
-- Let's update the Statistics with a FULLSCAN. UPDATE STATISTICS CustomersTableGuid WITH FULLSCAN GOBut when you look at the Statistics object now, you can see that SQL Server has only generated 3 steps in the Histogram.
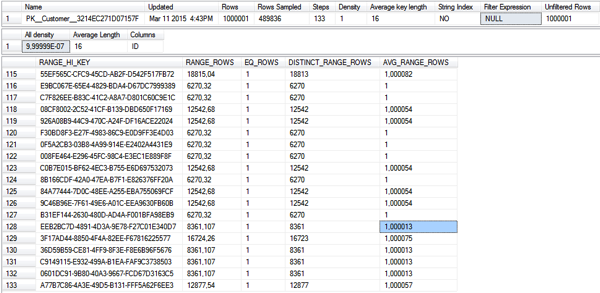
As you can see in the header information, all 1 million rows were sampled during the Statistics update, but the Histogram shows us only 3 steps! But when you now update the Statistics object with a lower sampling interval, things are changing:
-- Let's update the Statistics with a smaller sampling interval. UPDATE STATISTICS CustomersTableGuid WITH SAMPLE 50 PERCENT GOWhen you now look at the Histogram, you can see that we have a lot of different steps:
Summary
When Brent told me about this side-effect it made me smile. Bear this in mind when you work with UNIQUEIDENTIFIER columns in your database design. As long as the values are unique, you should not have a performance problem, because the row AVG_RANGE_ROW still makes the correct estimation of 1 row for the huge amount of gaps that you have in the Histogram.
[viral-lock message="Like or share to get the source code." tweet="Statistics on UNIQUEIDENTIFIER columns by @Aschenbrenner:" url="http://www.sqlpassion.at/archive/2015/03/16/statistics-on-uniqueidentifier-columns/"]You can find the script used during the demonstration here as a download.[/viral-lock]
Thanks for your time,
-Klaus


