

Last week I was puzzled by one of my colleagues - he needed help in creating a Report Builder 2.0 SSRS report based on several OLAP cubes utilizing measures from different cubes in the same field in the expression and grouped on the same logically common dimension - Period.
At first I though - impossible. You need a Linked cube for that! But then I got curious and decided to see if we could hash and slash through the report and make it work on scotch tape and pins. This article helped me get an idea on how to do it: http://blogs.msdn.com/b/robertbruckner/archive/2008/07/20/using-group-variables-in-reporting-services-2008-for-custom-aggregation.aspx
To achieve this we must make sure that all datasets from these different cubes return same number of rows and grouped by same logical dimension, e.g.: month-year or Period as it was in my case, and are sorted same way - so that we could line them up side-by-side and pretend they are all grouped on same dimension. Using Custom Code in SSRS create a Collection and push measures from cube A into it. Next - use those values with cube B measures by accessing the Collection with RowNumber("Tablix") as an index And that is all there is to it.
Now, in detail:
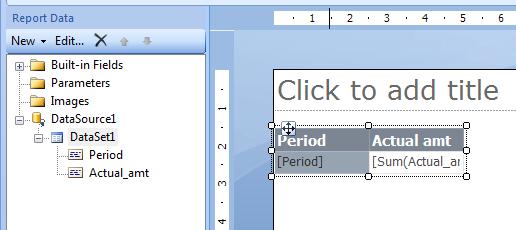
1. Create your first DataSet DataSet1 from cube A with Period at Rows and Actual amt measure, and Tablix Tablix1 with Period as Row Group and Actual amt as a total. Add sorting by Period
2. Create the second dataset - DataSet2 from another cube: cube B with Period at the Rows and Budget_amt measure
3. Make a copy of Tablix1 and paste it as anew tablix Tablix2 . Connect it to the dataset DataSet2
4. Right-click on the blue background outside of the report body, go to Properties->Code
Add following code into Custom Code window:
Dim denominators As System.Collections.Generic.List(Of Decimal) = New System.Collections.Generic.List(Of Decimal)
Function AddDenominator(ByVal newVal As Decimal)
denominators.Add(newVal)
Return newVal
End Function
Function GetDenominator(ByVal row As Integer) As Decimal
Return denominators(row)
End Function
5. Add following expression to the data field of the Tablix2: =Code.AddDenominator(Fields!Budget_amt.Value)

6. Delete the first column in Tablix2 but leave the associated group:

7. glue Tablix2 to Tablix1 by dragging it to the right side of Tablix1
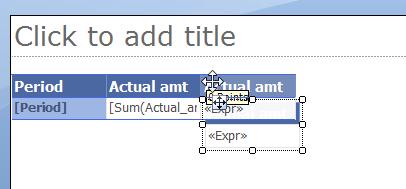
Now, make sure you see and align by these blue lines - both tablixes have to be aligned with these lines.
8. Make a copy of Tablix2 and paste it - you have Tablix3 now. Attach it to the right of Tablix2

9. Go to properties of Tablix3 and change the biding to DataSet1
10. Change Expression in the data field to =Fields!Actual_amt.Value + Code.GetDenominator(RowNumber("Tablix3") - 1)
11. Change the title of the Tablix3 column to Result
12. Change the title of the Tablix2 column to Budget

And here is the result - you have a Result column which uses totals from two different cubes in the expression Limitations: the column that pushes the totals from cue=be into the stack cannot be set to invisible but it could be as thin as you can get. Just squish it between Actual amt and result if you don't want to show it. Also, the order is important - pushing the value into the stack has to be before getting it from there, i.e. Budget column cannot be placed after Result column.
