

I had to do some performance testing for an upcoming MSSQLTips article and I thought I’d share the framework I used in a blog post.
First of all we have to log start and end dates of the package to a table so we can easily calculate the duration a package took to finish. This can probably be calculated from the SSIS catalog as well, but I was a bit too busy lazy to find out how to do this. Anyway, the logging table is created using the following statement:
IF NOT EXISTS (SELECT * FROM sys.objects WHERE object_id = OBJECT_ID(N'[dbo].[PackageLogging]') AND type in (N'U'))
BEGIN
CREATE TABLE [dbo].[PackageLogging](
[ID] [int] IDENTITY(1,1) NOT NULL,
[RunID] [int] NOT NULL,
[PackageName] [varchar](50) NOT NULL,
[StartDate] [datetime2](7) NOT NULL,
[EndDate] [datetime2](7) NULL
);
END
GO
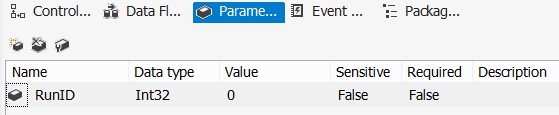
The RunID column is populated by a package parameter; I will come back to this later on.
The package starts with an Execute SQL Task to log the start. I use the following SSIS expression to construct the SQL statement on the fly, allowing you to easy copy-paste the logging task between packages.
“INSERT INTO dbo.PackageLogging(RunID, PackageName,StartDate) VALUES (” + (DT_STR,10,1252)@[$Package::RunID] + “,’” + @[System::PackageName] + “‘,SYSDATETIME());”
At the end of the control flow, there is an Execute SQL Task that updates the EndDate of the previously inserted row. The expression looks like this:
“UPDATE dbo.PackageLogging SET [EndDate] = SYSDATETIME() WHERE RunID = ” + (DT_STR,10,1252) @[$Package::RunID] + ” AND PackageName = ‘” + @[System::PackageName] + “‘;”
The RunID parameter is important to link those two Execute SQL Tasks together. A typical control flow looks like this:

Logging is the first step, now we have to run the package of course. I created a stored procedure that allows me to easily start a package in the SSIS catalog.
CREATE PROC [dbo].[RunPackage]
(@RunIDINT
,@PackageNameVARCHAR(50)
,@FolderNameVARCHAR(50)
,@ProjectNameVARCHAR(50)
,@SynchronizedBIT = 1 -- run synchronously by default
)
AS
DECLARE @execution_id BIGINT;

EXEC [SSISDB].[catalog].[create_execution]
 @package_name= @PackageName
,@execution_id= @execution_id OUTPUT
,@folder_name= @FolderName
,@project_name= @ProjectName
,@use32bitruntime= False
,@reference_id= NULL;

--SELECT @execution_id;

EXEC [SSISDB].[catalog].[set_execution_parameter_value]
 @execution_id
,@object_type= 30
,@parameter_name= N'RunID'
,@parameter_value= @RunID;

EXEC [SSISDB].[catalog].[set_execution_parameter_value]
 @execution_id
,@object_type= 50
,@parameter_name= N'SYNCHRONIZED'
,@parameter_value= @Synchronized;

EXEC [SSISDB].[catalog].[start_execution] @execution_id;

GO
The proc passes the @RunID parameter to the package, as well as other usual suspects, such as the package name, folder name and project name. You can also choose if a package is run synchronously or asynchronously. When run synchronously, the stored procedure doesn’t finish until the package is finished as well.
Using this stored procedure, it is easy to run a package multiple times in a row using a WHILE loop.
DECLARE @RunID INT = 1;

WHILE (@RunID <= 10)
BEGIN
EXEC dbo.RunPackage @RunID, 'myPackage.dtsx', 'myFolder', 'myProject', 1;
SET @RunID += 1;
END
The package is run synchronously, so that multiple instances do not run at the same time. This eliminates resource contention and gives us a clearer result of the performance of the individual package.
Using the following query, it is easy to build a nice chart in SSRS:
SELECT
 [RunID]
,[PackageName]
,[Duration] = DATEDIFF(MILLISECOND,StartDate,EndDate) / 1000.0
,[Mean] = PERCENTILE_CONT(0.5) WITHIN GROUP (ORDER BY DATEDIFF(MILLISECOND,StartDate,EndDate) / 1000.0)
OVER (PARTITION BY PackageName)
FROM [dbo].[PackageLogging]
ORDER BY ID;
The result:

I used RunID as category, PackageName as the series and the Duration/Mean as the values. I created a custom palette where I forced the Duration measure and the Mean to have the same color.
If you want to know what that chart is all about and what I was optimizing, keep your eye on the MSSQLTIPS website!
UPDATE
The MSSQLTips article mentioned in this blog post: Improve SSIS data flow buffer performance.
