This first post of 3 takes a quick peek at SSRS 2016 using the Community Technical Preview (CTP) 3.2. I will be making a quick post installation tweak and then guiding you through the steps to build your first report. If you are experienced with SSRS you can probably just scan this post to see the differences in 2016. See the past post Installing SQL Server 2016 for details on the install I did prior to working on this post.
Post 2 will cover some of the new features and changes to the old style SSRS reports (referred to as paginated reports).
Post 3 will cover the new Mobile Reports and KPI features.
SSRS is essentially a website that you can upload reports to giving people in your organisation a central place to go to get their data.
To start configuring SSRS open Reporting Services Configuration Manager from the start menu. This utility lets you configure the web server that will serve up the SSRS portal.
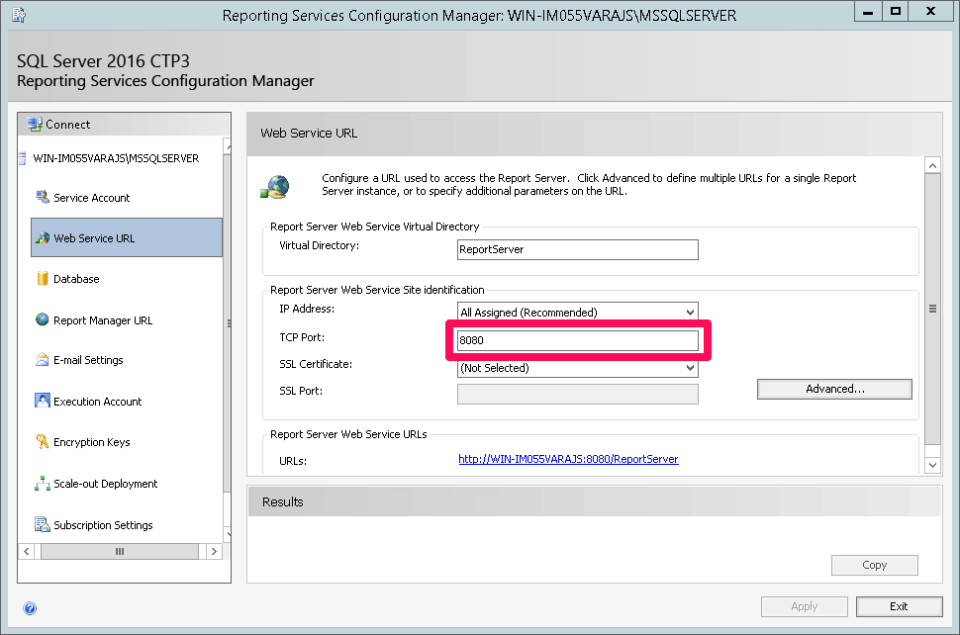
When everything is installed on the same box, like I have done for this test server, the default settings should be fine. One thing I am changing is my TCP port. This test server already has a website on port 80 so I’ll use 8080 for SSRS.
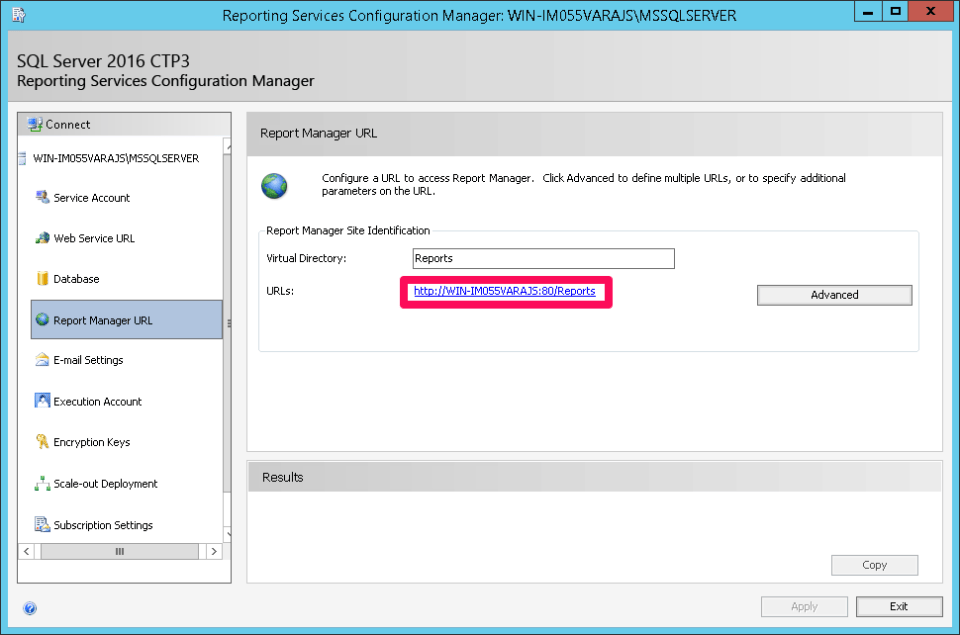
If you change the port number on the Web Service URL screen you will also need to configure that same port number on the Report Manager URL screen. The screenshot below shows that it still has the default port number.
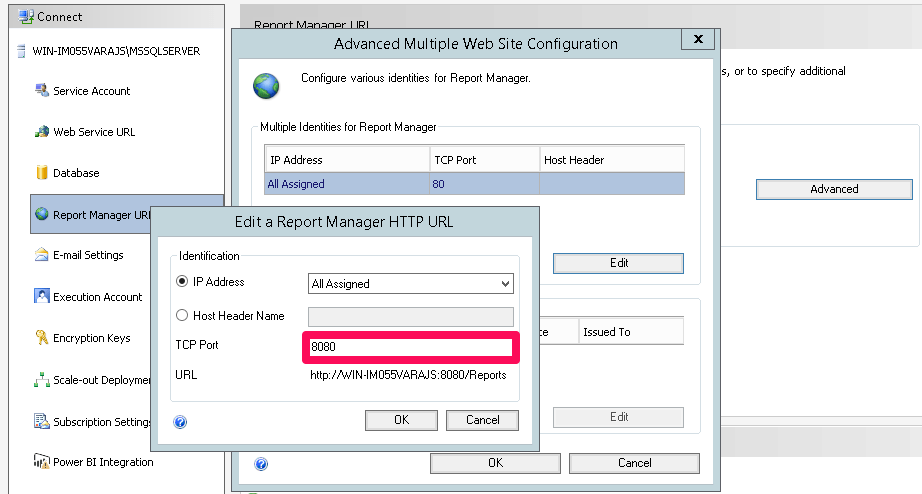
To set the new port number click Advanced and then edit.
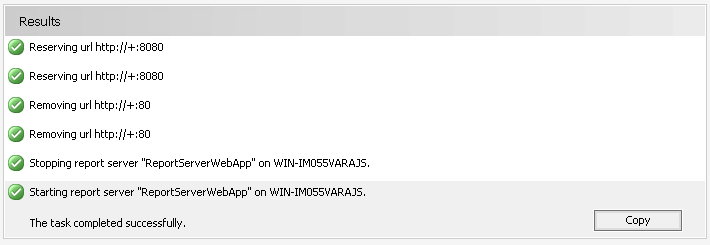
After confirming the port change you will hopefully see the output below with a column of nice green ticks.
Once set click the URL. This will open the old style portal on your newly installed SSRS.
Click “Preview the new Reporting Services” to see what all the fuss is about.
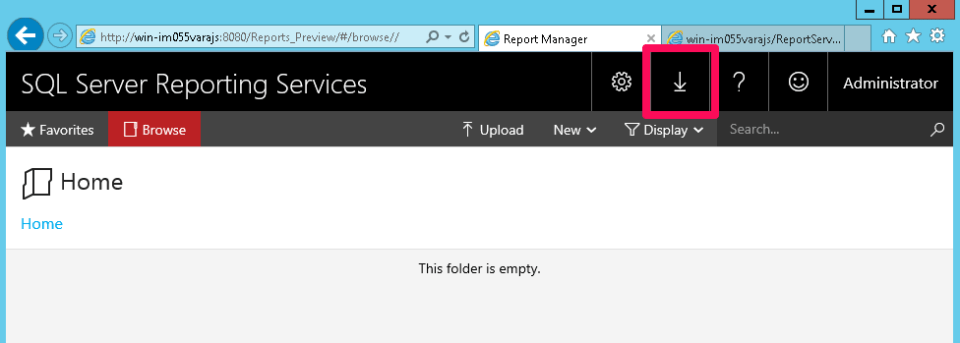
Straight away I noticed that the new portal doesn’t have the long spin-up time on first load that the old portal had. Clicking the down arrow icon and selecting Report Builder takes you to this link to download the Report Builder installer. Report Builder is the application we will use to develop our test reports. Report developers will most likely use SQL Server Data Tools (SSDT) to manage multiple reports.
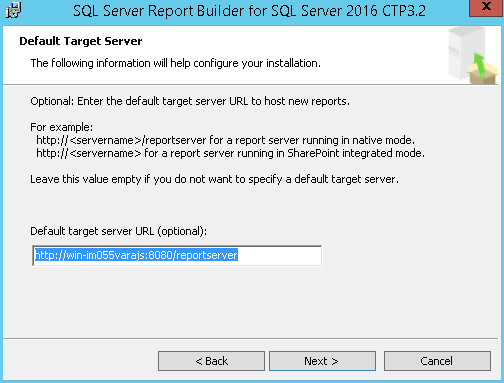
Download and click through the installer making sure to set the default URL as instructed. My install is in native mode so I needed /reportserver on the end of the URL.
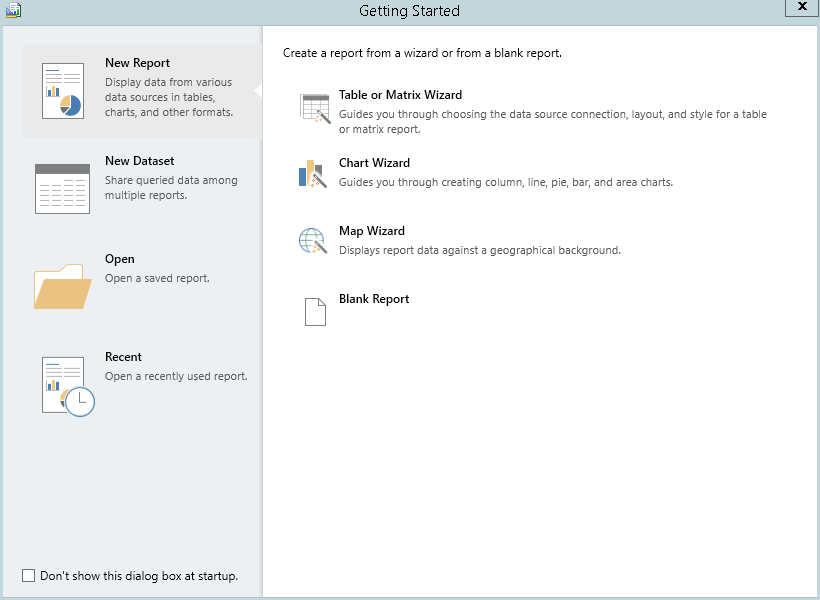
Once installed launch Report Builder to start building your first report.
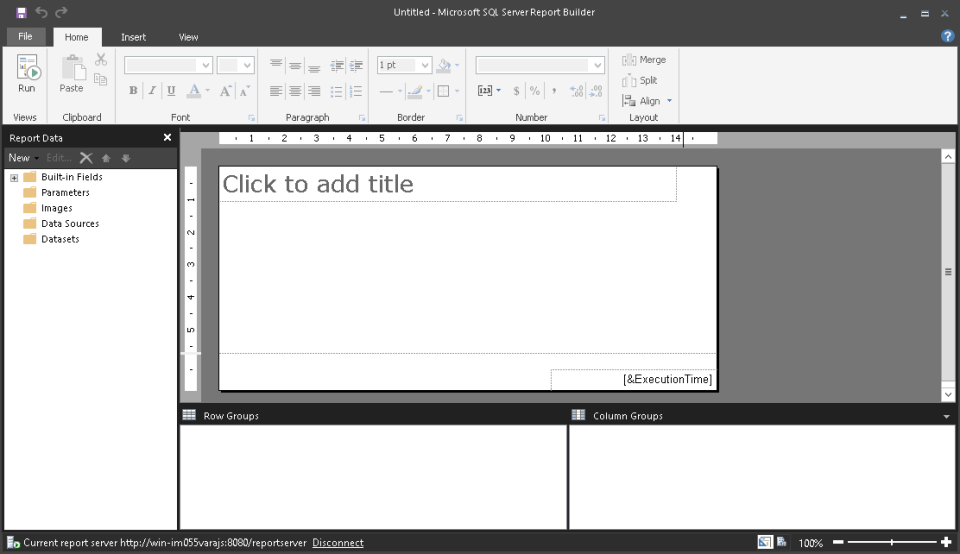
To anyone who has used SSRS and Report Builder in the past, the screenshot above will show that not much has changed here other than the style of the UI. Click Blank Report in the New Report section to open the Report Designer.
Before we can build a report we need some data. Right click Data Sources and select Add Data Source. Give the data source the name Master and select “Use a connection embedded in my report”. Enter your SQL Server’s connection details or localhost as server name if installed on the same machine as SSRS. Select master as the database and confirm.
Now we have a connection to our SQL Server we can build a data set to display in the report. Right click DataSets and select Add Data Set. Name the data set Databases and select “Use a data set embedded in my report”. Select our data source named Master then copy and paste the query below into the Query text box to populate the data set.
SELECT database_id AS DatabaseID,
name AS Name,
create_date AS CreatedDate,
state_desc AS [State]

FROM sys.Databases

ORDER BY database_id;
This query will return some basic information about each of the databases on the server.
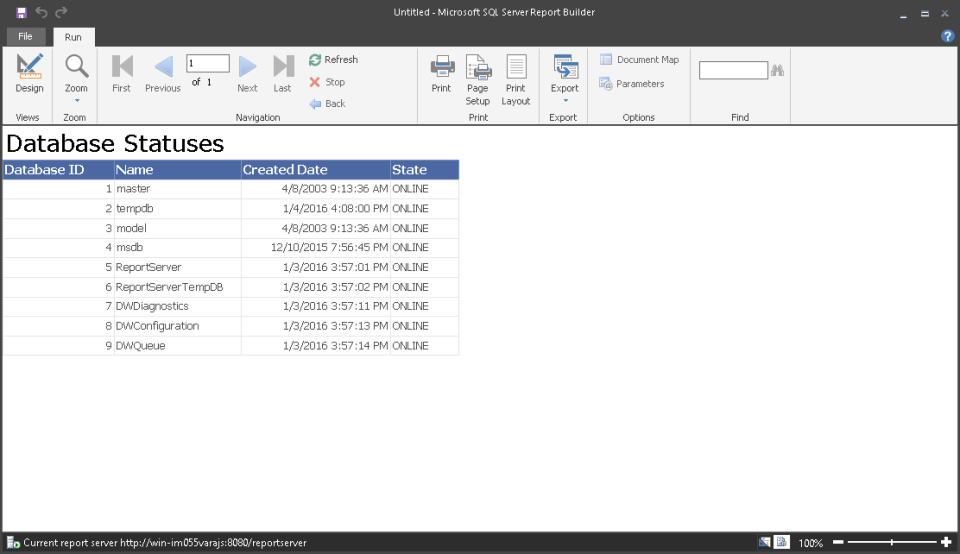
Confirming the data set settings will return you to the designer. Let’s tidy things up a bit before publishing this report. Click the title text box and enter “Database Statuses” Click Insert, Table and then Table Wizard. Select the Databases data set. On the next screen select all four fields and drag them into the Values box on the bottom right of the screen. Click through to the finish and confirm. Finally stretch the columns in the new grid so that the headers fit.
Hit Run!
Click Design to go back to the designer and save the report. Select a location on the SSRS Server to store the report. This will publish the report to the SSRS portal. Refresh your browser that you used earlier to view your new report on the portal.
This was a real high level first look at SSRS 2016. I will dive a little deeper in the next two posts.
The post SQL Server Reporting Services 2016 – Part 1 appeared first on The Database Avenger.


