

Query Store was, probably without doubt, the most anticipated and talked out new feature in SQL 2016. Certainly by the DBA community.
In this post we’ll just take a brief look at Query Store, what it is, how you set it running, and what you can use it for. This will be a fairly superficial overview – you’d need a book to cover it in detail – but hopefully this will give you a flavour of how useful this will be and how to get started.
What it does, at a base level, is actually quite simple. It just stores information relating to query execution over time.
That information consists of two things:
• Execution Plans – the execution plans generated for each query are stored in the query store, and if the plan changes the new plan is also stored.
• Performance metrics – information such as CPU consumption, reads and writes, are captured and stored for each query.
This information is aggregated over intervals (default is one hour) so you can see how query performance changes over time.
This isn’t earth shatteringly new, you can already query to find out the execution plan for a query and you can also query to find aggregated performance metrics related to a given query.
The difference is that now a history can be maintained without implementing additional monitoring. Previously the performance metrics would be aggregated as a single total since the last restart of the SQL instance – and would be cleared at the next restart. Now they are persisted and time-sliced so you can actually measure changes over time.
The simple activity of storing old execution plans is also profound for performance troubleshooting. Anyone who’s worked with large scale production data will have experienced the issue when a function that was working fine, fairly suddenly starts to develop performance problems.
A common cause of this is what’s known as “plan regression”. Basically this is where the execution plan has changed – and the new one’s just not as good as the old one for most executions. Previously you might suspect this was the cause of an issue you were seeing, but there was no way to easily prove it, now you can use query store to view and compare the old and new plans to verify this. You can even with a click or two force the query to go back to using the old (better) plan – though we hope people won’t overuse this and will try to at least delve into the cause and think about resolving it. There is usually a reason SQL thought the new plan would be better – and a particular plan may work for now but may not always be the best plan in the future as your data changes.
Let’s have a look at these features in little more detail.
Enabling Query Store
Query store is a database level configuration. It’s important to understand that, and that the information stored is actually stored within system tables in the database. That means that if you backup and restore the database, the information is retained. Also very importantly, the information is stored asynchronously – so there shouldn’t be any performance impact on the executed queries themselves. Unlike with the Live Query Stats, in this case a watched pot should boil just as quickly. There will of course be some overall server overhead at the point the data does get saved, but that shouldn’t be too significant.
So you can enable Query Store for a database through T-SQL (or in your source code) or through the GUI in SSMS. I just want to demonstrate doing this through the GUI so you can see some of the options. Right-click on the database, select properties, and then select the Query Store page all the way at the bottom:

Above you can see Query Store enabled for the WideWorldImporters database, with all default settings.
The first setting is “Operation Mode”. By default this is set to “Off”. To enable Query Store and get it running for a particular database you change it to “Read Write”. Job Done.
The Data Flush interval is how often the query store data gets written to disk – remembered I said this was asynchronous.
The Statistics Collection interval determines the size of the time slices that your query performance metrics get aggregated into.
Then we have some stuff about data retention. It’s worth noting that if your query store fills up and nothing is happening to clear it out then it flips to Read-Only mode and won’t store any more data until space is freed up. The default amount of space set for it is 100MB – that’s not a lot of space so I really can’t see any justification from that point of view for not enabling this feature.
Leaving the “Size Based Cleanup Mode” set to Auto should make sure that old data gets purged if the query store starts to fill up. Above that is the “Query Store Capture Mode” – if you leave that to AUTO it will ignore infrequent queries or those with negligible overhead.
The last setting “Stale Query Threshold” is how long it keeps data for in days. So 30 days for default. I can see it being useful to up this significantly it we want to use Query Store to be able to monitor performance over a long period, but it may depend on how much space Query Store wants to consume for your database – remember the default is 100MB but you can up that to whatever you like.
At the bottom of the properties page you can also see some nice pie charts that show how much of a proportion of your database Query Store has allocated, and how much of that space it is using.
So that’s Query store set up and configured, let’s have a look at a few of the things it gives us.
Query Store in Action and Forcing a Plan
I’ve set up Query Store as above in a copy of the WideWorldImporters databases on a SQL 2016 instance. I’ve created a stored procedure that I’m running every two seconds and I’ve set the Statistics Collection Interval in Query Store to 1 minute (rather than an hour) so that I can get some figures and graphs out fairly quickly.
Under the database in SSMS, there is now a Query Store folder where some built in reports reside:

For the sake of this blog post I’m just going to look at a couple of these. Let’s open the “Top Resource Consuming Queries” Report:
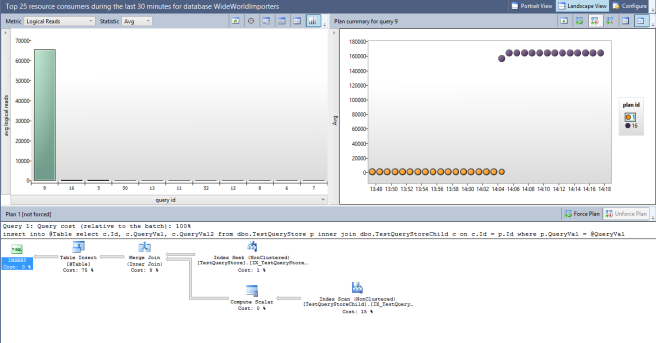
You can see a few things here. On the top left is a bar chart of the most expensive queries (you’ll notice one large one and the rest are negligible in comparison – the large one’s my query). You can configure whether you want to look by CPU or Logical Reads amongst other options and whether you want to look at averages, or maximums or minimums. Basically there a whole bunch of ways you can configure your view.
I’ll be honest that I struggled with some of these built-in Query Store reports to get them to show me what I wanted, so expect a bit of playing around to figure things out if you are using this feature.
In the bar chart, the bar highlighted in green is the currently selected query, on the right we can then see a scatter graph of the execution figures for this query across our statistics intervals (remember I’ve set it to have intervals of 1 minute). You can see I’m looking at average logical reads. You will also see that this query was ticking along nicely until about 14:05 when something happened (that was me!) and the logical reads for each execution of the query suddenly shot up. The blobs on the scatter graph have also changed colour at this point and that represents that the query is now using a new execution plan.
Next to this graph is a key telling us which plan each colour of blob represents and if you click on the plan in the key that you want, the plan itself is displayed in the bottom pane. At the moment I’m looking at the original plan (Plan 1). You will notice that the title specifies that it is “not forced”, you’ll also notice a button to the right of the title that gives us the option to “Force Plan”. Let’s just hold off a minute before we do that.
Before we change anything to try and fix the issue with this query, let’s look at the “Regressed Queries” report. This is pretty similar, but you may use it from a different direction. I.e. it may not be one your most expensive queries that has started going bad, so if you look in the Regressed Queries report it will focus on ones for which the execution plan has changed in the interval you are looking at. Again I found it a little challenging to get this report to show me the query I was interested in, some playing around can be required:

You can see here that I have just one big fat bar on my bar chart – as I only have one regressed query in the interval (last 30 minutes) I chose to look at. This can make it easier to identify queries suffering this issue.
I’m going to go back the the previous Resource Consumers report and try and fix the problem. Now, in reality I know what I did and why the query went bad. It was the result of something caused parameter sniffing, which is where, if a stored procedure recompiles, the execution plan that is formed may be different depending on the parameters it is executed with. Basically it forms the best plan for the parameters supplied – but that might not be the best plan for all sets of parameters. In this case I forced the stored procedure to form a plan that was going to be expensive in most cases. More on that in my next set of performance tuning workshops.
That issue would be best fixed in the code of the stored procedure, but in production, turning around a fix may take days and we have the problem right now. So let’s use the Force Plan functionality to fix the symptom – just for the moment.
I select the plan I want, and I click the “Force Plan” button. The effect is immediate and I notice it within minutes because my statistics collection interval is so small. I’ll let it run for a bit and then show you the new graph:

You can see the query has now returned back to healthy (quick) execution. Note the Orange blobs all now have a tick over them to denote that this plan is now forced.
Comparing Plans
A related feature in SQL 2016 is the ability to compare two execution plans to see what’s changed. I haven’t found this that amazing myself when I’ve looked at it, but that’s mainly due to the natural limitations – if two plans are significantly different then something that highlights the differences is just going to highlight the whole thing. However it can be useful at least to have both plans on screen at the same time so you can go back and forth easily.
You don’t need to do this through Query Store – if you right-click on any Execution Plan in SSMS there is now the “Compare ShowPlan” option, and as long as you have the plan you want to compare against saved as a file then you can go ahead. Note that one good thing is that this is an SSMS feature, so as long as you have SSMS 2016 you can use it to compare plans from on earlier versions of SQL Server.
With Query Store you can compare plans directly from the Store. If we go back to one of the reports above, the plans are listed in the key for the scatter graph. You can select more than one by using Shift+Click. Then you can click the button in the toolbar above the scatter graph which has the ToolTip “Compare the Plans for the selected query in separate window.”
Let’s do that for the two plans formed for our query above. The resulting view shows us two views side by side. It may be useful to look at these separately so they fit better on this page. On the left we have:
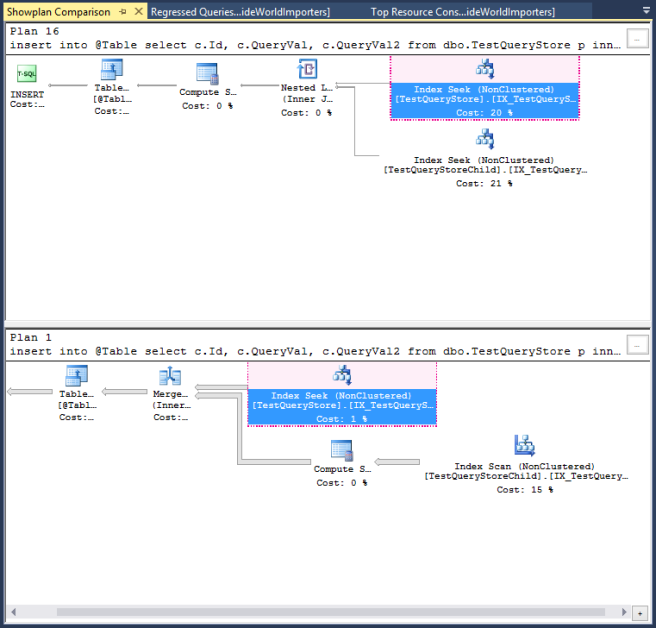
The area highlighted in Red is where the tool had identified that the two plans are the same. The rest it is not so sure about. All the same it’s a nice visual view just to be able to see what both plans are doing. On the right hand side of the screen you then get this view:
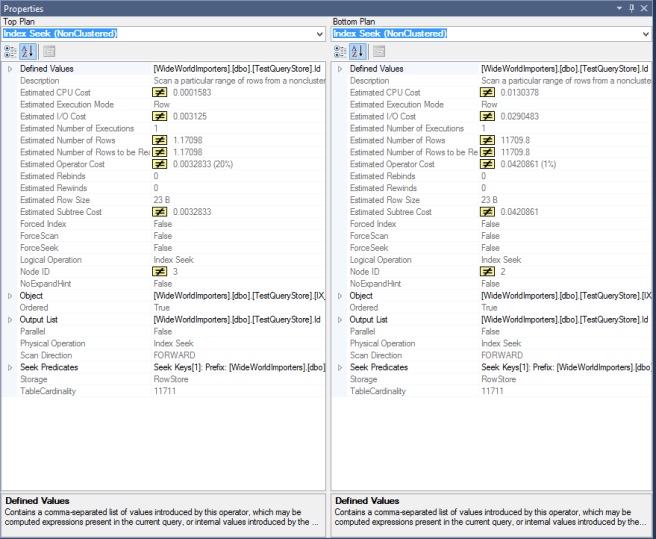
This shows us a comparison of the properties of whichever operator is selected in each plan – note this need not be equivalent operator in each plan. You can select the Nested Loop operator in the top and the Index Scan operator in the bottom and it will show you those – though the comparison may not be that meaningful!
So, this is kind of a useful tool, but don’t expect it to magically solve the process of comparing plans for you. In general too much changes from one plan to the next for it to be that simple – but this may help – a bit…
Query Store Catalog Views
Like everything else in SQL Server – all the information you can access through the GUI in SSMS, is available directly through the use of system catalogs and views. So if you want to examine the information in a way that isn’t supported by the built in reports then you can just go ahead and write your own queries.
The new views available are:
sys.database_query_store_options
sys.query_context_settings
sys.query_store_plan
sys.query_store_query
sys.query_store_query_text
sys.query_store_runtime_stats
sys.query_store_runtime_stats_interval
Rather than me going into detail here, I’ll just refer you to the MSDN reference:
https://msdn.microsoft.com/en-gb/library/dn818149.aspx
Conclusions
Query store is a great new feature. It’s not rocket-science but it is going to be very useful. In particular it will massively aid the investigation of production issues, saving time for those troubleshooting them at exactly the point they need time saving – right when everything’s hitting the fan.
It should also be very useful for monitoring performance over time and being able to keep ahead of scalability issues with specific queries.
The new methods for forcing a plan are also excellent for quick fixes – but there is the fear that this will be overused. It is possible to force plans in earlier versions of SQL – but tricky, so people usually just fixed the code. Forcing plans can end up being a case of treating the symptoms rather than the cause – and can lead to other problems later on.
From a personal l point of view I’m looking forward to the day when someone asks me to look at some problems in a production system, and I find out it’s on SQL 2016 and Query Store is enabled. My confidence in finding the answers quickly will be massively improved.
Of course then I’ll probably find out that is hasn’t been configured correctly to purge old data and has been read-only for the last 6 months- but hey-ho!

![]()
