

Do you think you need to use commercial tools like SQL Diagnostic Manager, SQL Sentry, Spotlight etc.. ? Or do you think the built-in features are enough? There are complelling arguments in favor of each.
In this blog I hope to touch on every built-in feature to gather the performance information, some give real-time overviews of your databases whereas others provide detailed, on-demand data on SQL Server health and performance. I hope you learn something new.
There are several ways to use T-SQL queries to monitor SQL Server, using dynamic management views, built-in functions, stored procedures, or system data collections…DMVs are virtual tables that you can query on adhoc or as part of your custom, automated monitoring. Some shows sql server state at a particular instant whereas others, especially those that deal with performance counters, measures values on a regular internal and show you the difference between two samples.
sys.dm_os_performance_counters DMV is of particular interest to view every performance object and counter of interest.
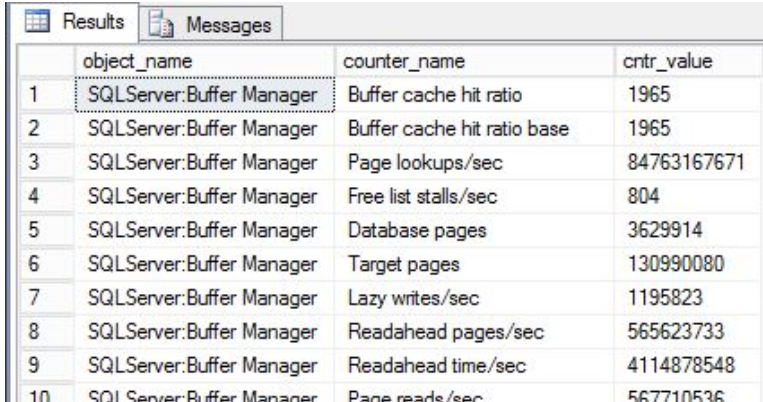
For example, to view the buffer manager performance object values:SELECT object_name, counter_name, cntr_value FROM sys.dm_os_performance_counters WHERE object_name = 'SQLServer:Buffer Manager' AND cntr_value != 0;
go
You’ll get a result similar to this:
My goal here is not to teach you each dmv, rather teach you to teach yourself! You can find all such views in a system view sys.system_objects.
select top 10000 * from sys.system_objects where type_desc = 'view' order by name
For example, Filter the results on specific terms lie hadr for the always on views.
select top 10000 * from sys.system_objects where type_desc = 'view' and name like '%hadr%'order by name
HA Clusters:
select top 10000 * from sys.system_objects where type_desc = 'view' and name like '%cluster%'order by nameTo get a better understanding or each dmv, you should check out the specific documentation.Built-in functions
Unlike dynamic management views, which return data in the form of virtual tables, built-in functions return system data as single numerical values, calculated since the server was last started. You can call each built-in function as the argument of a SELECT statement. For example, you can use the built-in function @@connections to return the sum of successful and unsuccessful connections over time:SELECT @@connections AS "Total Connections";GO
Total Connections----------------- 121
Note: @@connections increments every time a user attempts to log in (even if the attempt is unsuccessful).
The only built-in system statistics function that doesn’t return a single numerical value is sys.fn_virtualfilestats.System stored procedures
Most stored procedures help with administrative tasks such as attaching a database or adding a login, but some stored procedures report metrics. But there are plenty that return stored meta data/configuration information.
EXEC sp_spaceused;
Management Data Warehouse
Simply put, MDW is SQL Server databases to store the state and performance data are stored from one or more SQL Servers. From there reports are generated and you can also create your own custom reports.
This feature actually brings it much closer to the way the compercial monitoring tools work and someday might make the paid tools completely redundent.
It uses the SQL Server Integration Services to automate the task of querying the database and writing the results to the Management Data Warehouse.
To read more on it:
SQL Server Management Studio
Activity Monitor
The Activity Monitor makes it possible to view SQL Server metrics in real time. To use the Activity Monitor, type “Ctrl-Alt-A” or click the icon within the SSMS toolbar.To view execution plan for an expensive query, right click on the query and select Show Execution Plan:Note: You can’t adjust the sizes of the graphs or the metrics they show. Nor can you change the way the Activity Monitor calculates the statistics for query performanceDashboard Reports
There are about 20 standard dashboards reports in SSMS.You can create a custom report. And if you are keen to develop more reports, check out the Power BI , SQL Server Reporting Services (SSRS) etc. that provides more features PDF-ready reports, reports for the mobile devices etc..Performance Monitor
Windows Performance Monitor helps you visualize system-level resource usage from your Windows hosts, and enables you to correlate these metrics with SQL Server performance counters in time series graphs.You can launch it from the Administrative Tools menu group or run the following from the Run window:
%windir%\system32\perfmon.msc /sOnce in there, click on the Performance Monitor on the left and it will automatically start showing the percentage processor time. Click on the + to add more performance counters, including SQL Server counters.
Now, do you still think you need to use commercial tools like SQL Diagnostic Manager, SQL Sentry, Spotlight etc.. ?
Even though the gap between the two has decreased significantly, I think they still have a place in enterprise database monitoring and tuning. If for nothing else then for the ease of setup and use (in some cases, out of the box) and if you have already made significant investments in them in the past.I also think that they are supplementary vs complementary to each other and you should use them both.
Do you think you need to use commercial tools like SQL Diagnostic Manager, SQL Sentry, Spotlight etc.. ? Or do you think the built-in features are enough? There are complelling arguments in favor of each.
sys.dm_os_performance_counters DMV is of particular interest to view every performance object and counter of interest.
go
For example, Filter the results on specific terms lie hadr for the always on views.
Total Connections
Note: @@connections increments every time a user attempts to log in (even if the attempt is unsuccessful).
This feature actually brings it much closer to the way the compercial monitoring tools work and someday might make the paid tools completely redundent.
It uses the SQL Server Integration Services to automate the task of querying the database and writing the results to the Management Data Warehouse.
%windir%\system32\perfmon.msc /s
In this blog I hope to touch on every built-in feature to gather the performance information, some give real-time overviews of your databases whereas others provide detailed, on-demand data on SQL Server health and performance. I hope you learn something new.
There are several ways to use T-SQL queries to monitor SQL Server, using dynamic management views, built-in functions, stored procedures, or system data collections…
DMVs are virtual tables that you can query on adhoc or as part of your custom, automated monitoring. Some shows sql server state at a particular instant whereas others, especially those that deal with performance counters, measures values on a regular internal and show you the difference between two samples.
sys.dm_os_performance_counters DMV is of particular interest to view every performance object and counter of interest.
For example, to view the buffer manager performance object values:
SELECT object_name,
counter_name,
cntr_value
FROM sys.dm_os_performance_counters
WHERE object_name = 'SQLServer:Buffer Manager'
AND cntr_value != 0;
go
You’ll get a result similar to this:
My goal here is not to teach you each dmv, rather teach you to teach yourself! You can find all such views in a system view sys.system_objects.
select top 10000 * from sys.system_objects where type_desc = 'view' order by name

For example, Filter the results on specific terms lie hadr for the always on views.
select top 10000 * from sys.system_objects
where type_desc = 'view'
and name like '%hadr%'
order by name

HA Clusters:
select top 10000 * from sys.system_objects where type_desc = 'view'
and name like '%cluster%'
order by name

To get a better understanding or each dmv, you should check out the specific documentation.
Built-in functions
Unlike dynamic management views, which return data in the form of virtual tables, built-in functions return system data as single numerical values, calculated since the server was last started. You can call each built-in function as the argument of a SELECT statement. For example, you can use the built-in function @@connections to return the sum of successful and unsuccessful connections over time:
SELECT @@connections AS "Total Connections";
GO
Total Connections
-----------------
121
Note: @@connections increments every time a user attempts to log in (even if the attempt is unsuccessful).
The only built-in system statistics function that doesn’t return a single numerical value is sys.fn_virtualfilestats.
System stored procedures
Most stored procedures help with administrative tasks such as attaching a database or adding a login, but some stored procedures report metrics. But there are plenty that return stored meta data/configuration information.
EXEC sp_spaceused;

Management Data Warehouse
Simply put, MDW is SQL Server databases to store the state and performance data are stored from one or more SQL Servers. From there reports are generated and you can also create your own custom reports.
This feature actually brings it much closer to the way the compercial monitoring tools work and someday might make the paid tools completely redundent.
It uses the SQL Server Integration Services to automate the task of querying the database and writing the results to the Management Data Warehouse.
To read more on it:
SQL Server Management Studio
Activity Monitor
The Activity Monitor makes it possible to view SQL Server metrics in real time. To use the Activity Monitor, type “Ctrl-Alt-A” or click the icon within the SSMS toolbar.

To view execution plan for an expensive query, right click on the query and select Show Execution Plan:


Note: You can’t adjust the sizes of the graphs or the metrics they show. Nor can you change the way the Activity Monitor calculates the statistics for query performance
Dashboard Reports
There are about 20 standard dashboards reports in SSMS.
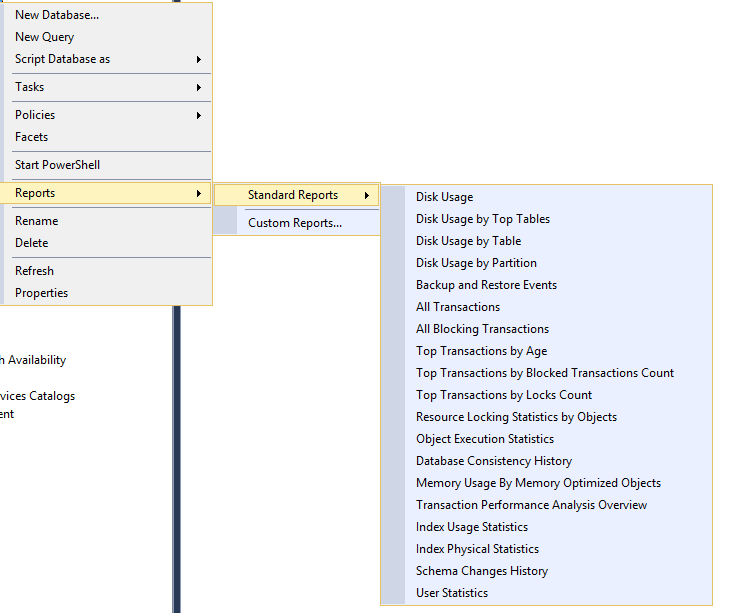
You can create a custom report. And if you are keen to develop more reports, check out the Power BI , SQL Server Reporting Services (SSRS) etc. that provides more features PDF-ready reports, reports for the mobile devices etc..
Performance Monitor
Windows Performance Monitor helps you visualize system-level resource usage from your Windows hosts, and enables you to correlate these metrics with SQL Server performance counters in time series graphs.
You can launch it from the Administrative Tools menu group or run the following from the Run window:
%windir%\system32\perfmon.msc /s

Once in there, click on the Performance Monitor on the left and it will automatically start showing the percentage processor time. Click on the + to add more performance counters, including SQL Server counters.

Now, do you still think you need to use commercial tools like SQL Diagnostic Manager, SQL Sentry, Spotlight etc.. ?
Even though the gap between the two has decreased significantly, I think they still have a place in enterprise database monitoring and tuning. If for nothing else then for the ease of setup and use (in some cases, out of the box) and if you have already made significant investments in them in the past.
Even though the gap between the two has decreased significantly, I think they still have a place in enterprise database monitoring and tuning. If for nothing else then for the ease of setup and use (in some cases, out of the box) and if you have already made significant investments in them in the past.
I also think that they are supplementary vs complementary to each other and you should use them both.
