

Recently I had a chance to participate in the Toronto Public Library Open Data Hackathon (tpl.ca/hackathon) to brainstorm and come up with different ideas that would improve library services. Our team designed a prototype of web application that would enhance library users experience with book clubs. And I proposed to build a reporting layer for library staff who may analyse a potential impact of improved book club experience to a number of new visits and new registrations to the library.
I also wanted to explore Microsoft PowerMap technology in its way of portraying geo layers based on custom region KLM and SHM files which contain custom polygons (Power Map for Excel–May update for Office 365). Before I share how easy or not easy use of shape files for PowerMap was, let me show you a final version of our team PowerMap video that was created for this hackathon:
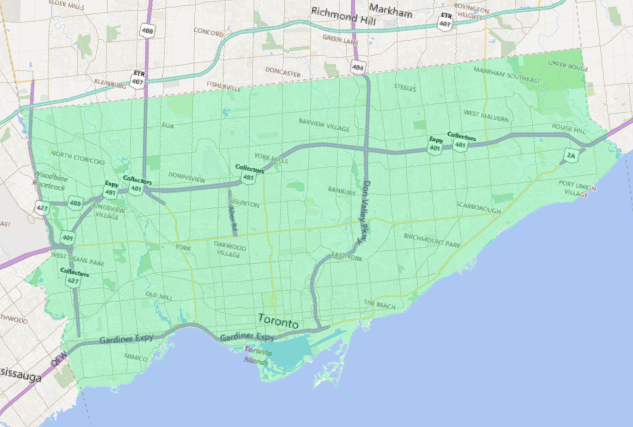
So after pulling some historical library datasets that they provided to us into my model; I created my initial PowerMap tour graphics. Which I further wanted to enhance with custom region geo files form the (City of Toronto Open Data Catalogue):
- Regional Municipal Boundary
- Neighbourhoods
Currently PowerMap custom regions support only County/Region, State/Province, Postal Code and Custom Region based on geo shape files:
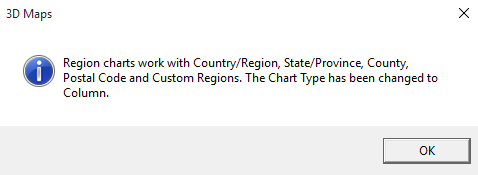
However I was able to overcome this limitation by just renaming the City field (column) name to something else (e.g. CityName or CustomRegion, it’s your choice); and once it wasn’t longer as City, then I was able to map it to the Toronto Regional Municipal Boundary shape file attribute.
The other more difficult thing was to portray a set a polygons from another shapefile which contained information of 140 Toronto neighbourhood regions. I had a list of neighborhood regions in my data model and no matter how hard I tried, I couldn't make them visible in my PowerMap visualization.
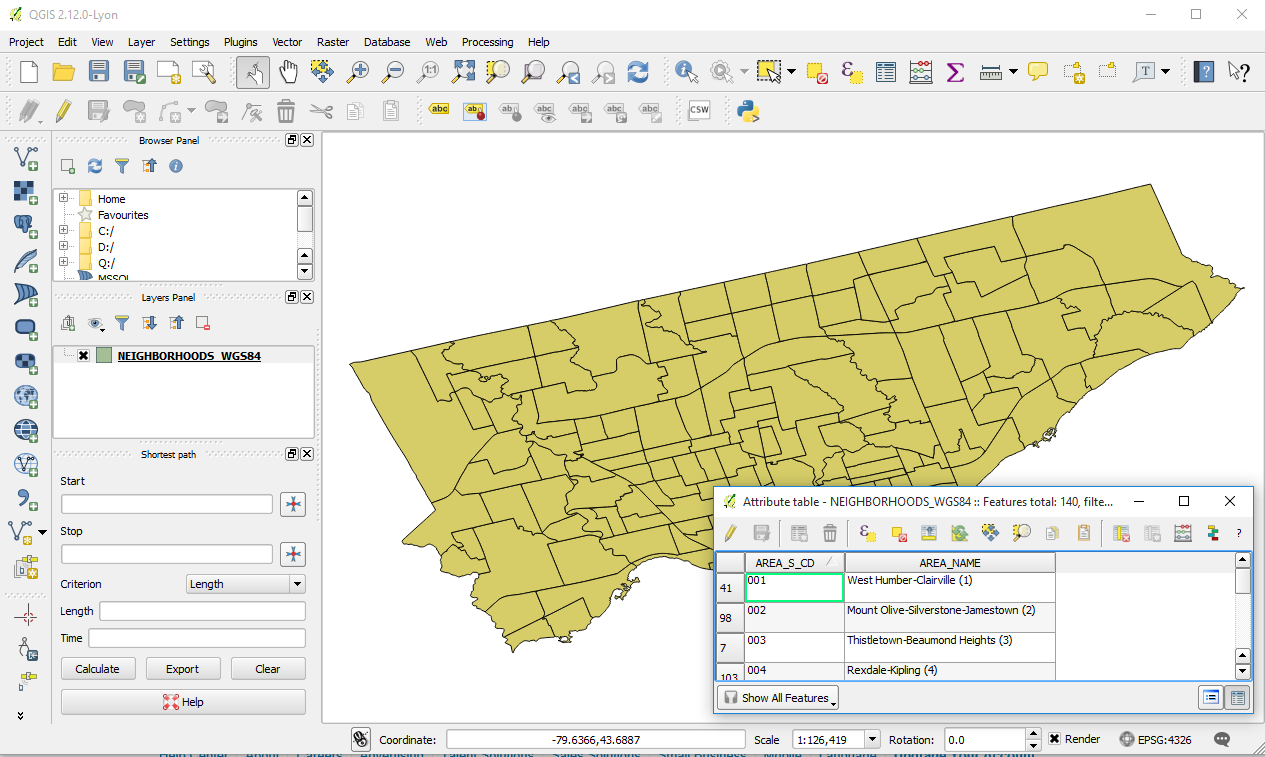
So I started to research this a little bit more and found one hint in one of the PoweMap examples that Microsoft provided. For one of their models their provided this note that their shape files was slightly adjusted by a GIS software [QGIS tool http://qgis.org]. And I installed this software on my machine because I didn’t know other way of what was inside of downloaded shape files.
So using the QGIS tool I was able to see how that shape file was constructed and I also saw the reason I wasn’t able to map my data model data sets with attributes from the shape file.
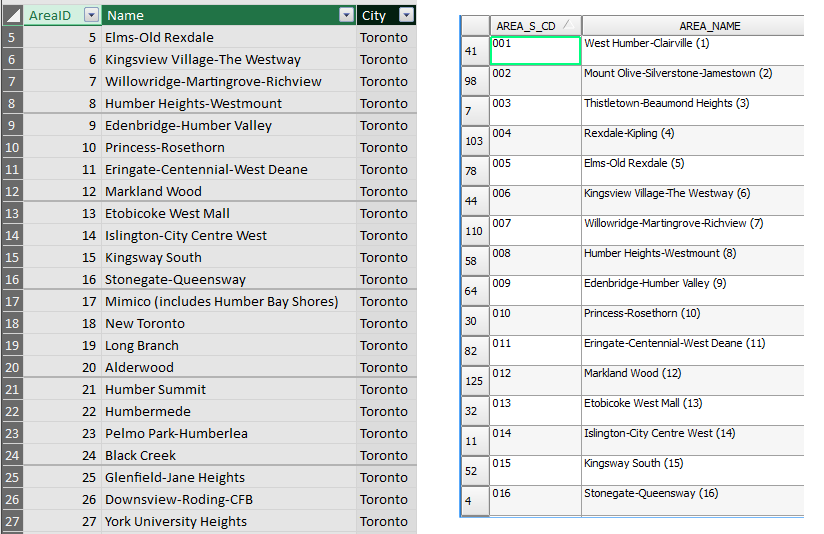
I didn’t dare to change geo file and thought it would be easier to adjust my model data set, and that change made all the difference. Now all 140 regions became visible in my PowerMap visualization! Good for Microsoft and thanks to GIS and Toronto Open Data Catlog for providing software and necessary data sets.

My key learning in this PowerMap with custom regions (shape files) exercise are:
- Don’t trust region shape file metadata (use GIS tool to check shape file content, especially attribute table);
- I can easily overcome existent PowerMap limitation of mapping only County/Region, State/Province, Postal Code to geo location points, it’s your choice how to name them;
- This leads to my 3rd finding that my model data sets can be mapped not only by names but ID or other fields as well. Because when you import a region shape file it will ask to pick a region name from a list; and I was able to map my polygon and model data sets by their reference IDs as well. So it's like a table to table relationship by reference fields that you choose.
I’m was very pleased with how Microsoft improved PowerMap with the new Custom Region feature based on external geo shape files. And I am even more happy to learn that they plan to enable this PowerMap visualization in the PoweBI! How soon, I don't know.
Please leave your comments or if you have some further questions, I'd be glad to share all that I have learned.
Happy data adventures!
[2015-Nov-24] Just a brief update: I’ve recently contacted both PowerMap and Power BI teams in terms of enabling the Excel PowerMap visualization in Power BI. The PowerMap team informed me that there was no plan to move their client application to Power BI; however they had also mentioned that 3D Map would be available in a form of custom visualization. And today Power BI team has announced availability of the Globe Map visualization (http://blogs.msdn.com/b/powerbi/archive/2015/11/24/visual-awesomeness-unlocked-the-globe-map.aspx).
So synergy is in the air! 🙂
