Every year at Pragmatic Works some coworkers, including consultants, marketing staff, support team members, software development staff and project management, partake in a company fantasy football league. And with the recent release of the new Power BI Desktop, I thought what better way is there to prepare to completely annihilate my coworkers and friends in an imaginary nonsensical game than by creating some nifty Power BI dashboards based on last years player stats as recorded by Yahoo! Sports. So I thought I’d walk you through some of the steps I followed to leverage the Yahoo! Sports NFL player stats page as a data source and some of the query transformations I applied to prepare the data for reporting.
Click here to download my Fantasy Football Dashboards Power BI .pbix file.
If you’re completed new to Power BI Desktop I highly suggest you watch my video walkthrough of Power BI Desktop or read my blog post which walks you through each step of creating your first Power BI dashboards with Power BI Desktop. Last Friday, I also blogged about my three best practices for designing a killer Power BI solution, so take a look at that.
To create these dashboards, I simply navigated to the Yahoo! Sports NFL stats page and found the page for each position I’m interested in for this fantasy football season. I copied the URL to my clipboard. In Power BI Desktop, click Get Data and then use the Web data source option. Then all you have to do is copy and paste the URL into the text box and click OK.
Then select the HTML table that contains your data and click Edit. We need to edit our query because there are some issues with the data. By clicking Edit, we can apply transformations to our query which will allow us to do things like rename columns, remove unwanted columns, modify data types, create custom columns and much more.
One thing you’ll notice in the above screen grab is that the column names are in the first row, so we need to fix that.
On the Home ribbon of the Query Editor, just click the Use First Row As Headers button. Pretty easy stuff, huh?
I also went through and removed unnecessary and empty fields from the query by right-clicking the unwanted columns and clicking Remove.
Next, I configured the data types for each column by selecting the column I wished to modify and then selecting the correct data type on the Transform ribbon. I performed this step for each numeric column in the table, otherwise Power BI will treat the field as a text data type which will prevent us from aggregating the numbers as a measure in our dashboards. If you’re new to Power BI, the meta data of our data sets is very important to designing an excellent Power BI solution. When you’re done modifying your query, go to File and click Close and Load to load the data into the semantic model.
Next I navigated to the Data view and clicked the New Column button.
Then I clicked the Create Column button on the Modify ribbon to create some new metrics that will help me measure the effectiveness of each player at their position. Here’s a few examples of some of the calculated columns I created:
- Name = Right([Full Name],Len([Full Name])-FIND(” “,[Full Name])) & “, ” &Left([Full Name],1)&”.”
- Yds Rank = RANKX(‘QB Stats’,[Yds])
- QBR Group = if([Yds Rank] <= 10, “Tier 1″, if(‘QB Stats'[Yds Rank] <= 20,”Tier 2”,if([Yds Rank] <=32, “Tier 3”, “Tier 4”)))
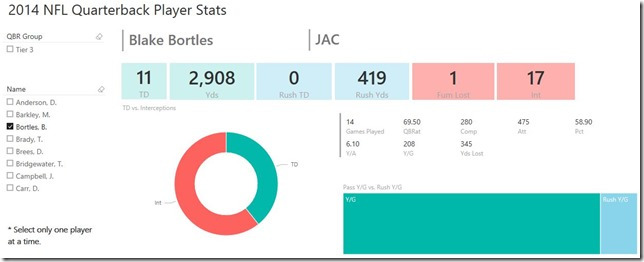
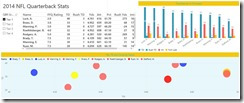
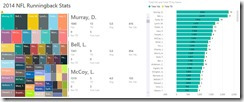
Then I was ready to start creating some dashboards! You can see the dashboards I’ve created in the below screen shots.
If you’re interested in downloading my Fantasy Football Power BI Dashboards for your own amusement, click here to get the .pbix file.
Feedback?
If you enjoyed this post and the content, share it with your friends and network. And if you have any questions, comments or feedback please leave a comment below. Thanks for reading!


