

 T-SQL Tuesday is a monthly event where SQL Server bloggers write a post based on a subject chosen by the month’s host. This month’s host is Matt Gordon (t|b) and his topic is Fixing Old Problems With Shiny New Toys. I’ll be talking about the (so new and shiny that it’s not out yet) Power BI in SSRS.
Having Power BI reports in SSRS will be a huge addition to the reporting platform that was feeling dated, even with the new features introduced in 2016. This will help with the problem of businesses and clients expecting interactive reports, but having to make do with the paginated reports in SSRS. Power BI brings these interactive reports and they work with many different data sources. They are easy enough to configure for non-technical people to be able to explore their data on their own. But first, we (the technical people) need to set it up – luckily this too is very simple.
This version of SSRS and Power BI is still in preview but a production ready release is possible this summer. See here for more info.
Introducing the new SSRS Stand-Alone Installer
This is a really nice touch for the next version of SSRS. It’s surprisingly small (50MB) and quick to install. Download the new installer (SQLServerReportingServices.exe) and the PowerBI desktop app here.
Run the SSRS installer.
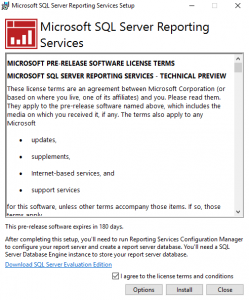
After clicking next the install is done!
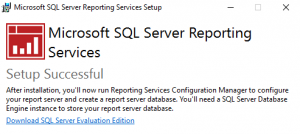
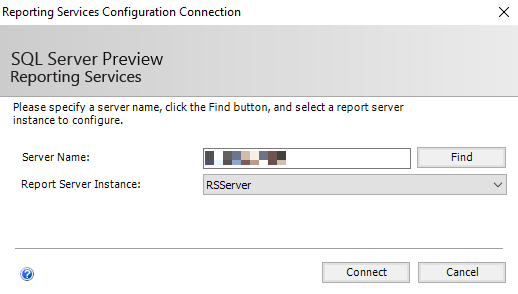
Click Configure Report Server and the familiar Report Services Configuration Manager appears. Then click connect to connect to the newly installed report server.
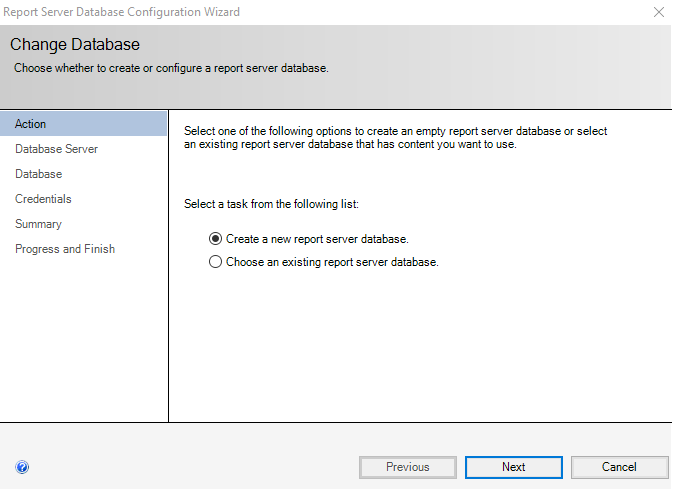
On the database screen, click Change Database and select Create a new report server database.
Enter the server\instance name of a SQL Server instance to host the SSRS databases. Be sure that your SQL instance allows remote connections.
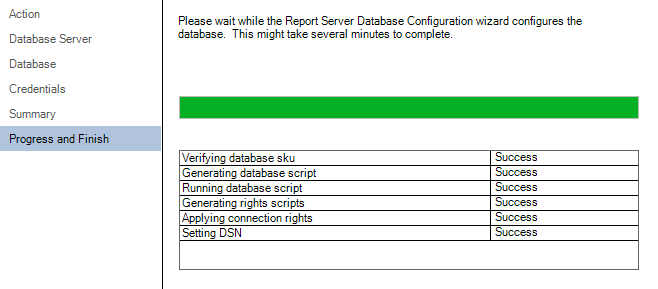
For a production instance, I would be creating service accounts but for this test I will just click next to retain the default accounts and settings. When complete, you should see this screen.
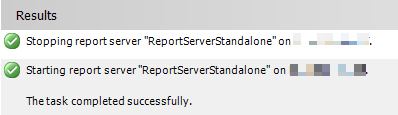
You will also see that the report server service has started
You may need to switch to a port other than 80. I explain how to switch to port 8080 in my post SQL Server Reporting Services 2016 – Part 1
To access the SSRS portal, click the URL in the Web Portal URL section.
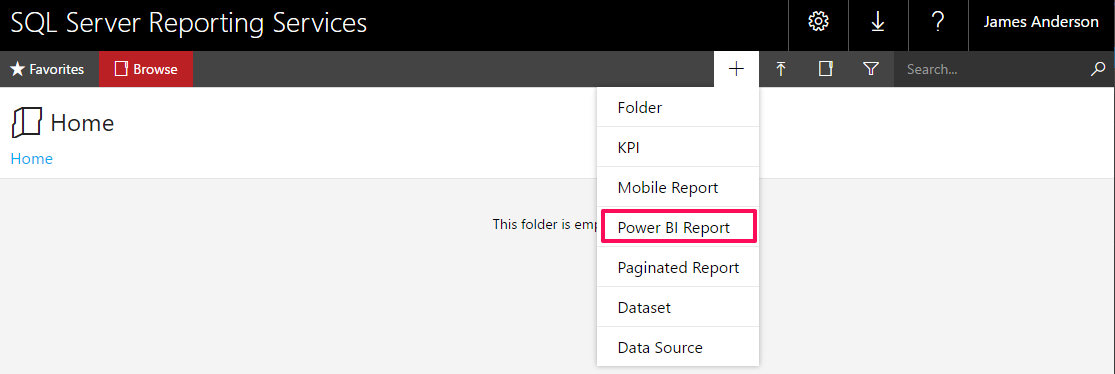
Click the + symbol to create a new report and you will see the option for a Power BI report. Before we can build a Power BI report, we need to install the Power BI desktop app.
The PowerBI Desktop App
Run the PowerBI desktop app, that we downloaded earlier, and click next until the end.

Currently, the preview will only allow a Power BI report that’s published to SSRS to connect directly to an SSAS tabular model database. For this post, I’ll use a tabular model database I already have, that contains an open dataset on UK immigration. This is a very simple model with one table containing country names and the other containing applications for asylum to the UK by nationals from the countries in the first table. This dataset, and many others, can be found here.
Open the newly installed Power BI Desktop app, click Get Data on the welcome screen and select SSAS.

Enter the server\instance name and the database name. I’m using Connect live but Import can be useful if you want to format data types differently compared to how they are in SSAS.

In the navigator section, select the model of the tabular project (or any perspectives if you have them).

In the designer, I clicked New Visual and selected Filled Map from the Visualisations pane. I dragged and dropped my Country column to the Location field and the Total Applications column to the Colour Saturation field. With that, my data is plotted onto the world map.

To make this an interactive report , I added a bar chart visualisation at the top of the canvas. I dragged and dropped the Year column to the Axis field and the Total Applications column to the Value field.

It’s now possible to filter the results by year when clicking a bar on the bar chart.

To publish the report, click Save As and select Reporting Services.

After naming the report you should get the message below.

Click the Take me there link to open the report in SSRS.

There you have it, an interactive Power BI report in SSRS. When this feature drops sometime in the summer, I can see it making a huge difference to companies’ existing reporting solutions.
The post Power BI in SSRS – T-SQL Tuesday appeared first on The Database Avenger.
