

I finally finished putting together version 2 of my Power BI architecture diagram. I previously put together an architecture diagram but as fast as Power BI is changing, v1 of the diagram was quickly obsolete. I always wanted to come back and add more to the diagram to make it more complete but now that SQL Server 2016 is generally available and enhancements have been made to Power BI to facilitate integration with Excel and SSRS, it made sense to do another diagram.
The reason I originally created this diagram was to use as a tool during conversations with my customers. But I’ve also used the diagram in other presentations and found it beneficial while teaching about how Power BI works. I wanted to make this resource available to others for their benefit. So here’s v2.
Click here to download a .zip file with the .pdf and .png files.
I’ve included a few new things to make the diagram up to date with the latest changes to Power BI, SQL Server Reporting Services, and Excel.
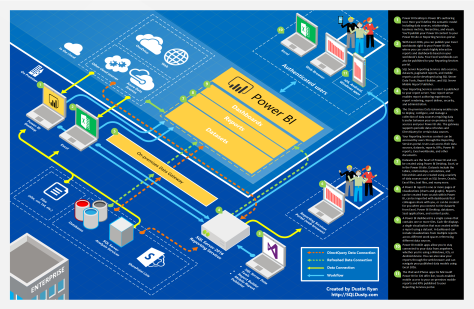
This document includes components to illustrate:
- Publishing Power BI desktop files and Excel workbooks to Reporting Services
- Publishing Excel workbooks to a Power BI site
- Browsing Power BI data models with Excel
- Publishing Reporting Services content to the Report Server
- Browsing Reporting Services mobile reports and KPIs using Power BI apps
Feel free to download this content and use it in your presentations, discussions, and for your own learning. I hope you find it useful and if you do, share it with a friend.
Feedback?
Do you have any feedback on this diagram or anything you’d like to see me change? Leave a comment or let me know! Thanks!

![]()
