Statistics, in simplest terms, refer to the distribution of data in a column or index. They are represented in a form of a histogram with at the most 200 steps, regardless of the number of rows in the column or index. A lot about statistics can be found in this article by Grant Fritchey.
Today, we’ll have a look at one specific performance issue. I will be using the StackOverflow database and executing my queries on SSMS 2014 for the purpose of this presentation.
Let’s assume we run the following query quite often.
SELECT Id, DisplayName, Age
FROM Users
WHERE Age >= 18
ORDER BY DisplayName
Anticipating contention on the clustered key and adverse performance, I also created a covering index for this query:
CREATE NONCLUSTERED INDEX [IX_Users_Age_Includes]
ON [dbo].[Users] ([Age])
INCLUDE ([Id],[DisplayName])
Since the addition of this index a number of users updated their age.
And now, when I run the query, the actual execution plan of it looks as below:
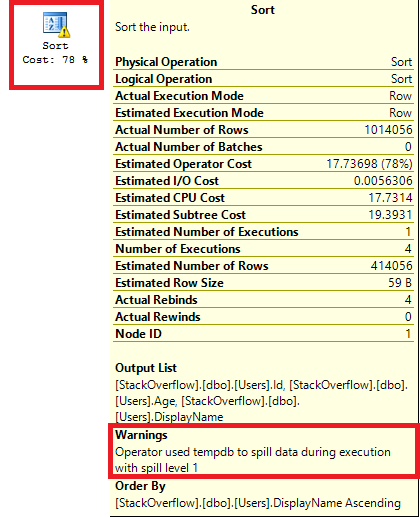
That’s strange – there is a warning sign on the sort operation and if we hover our mouse over it we can also see more information.
These warnings have been introduced since SSMS 2012. The sort spill to tempdb warning means that the query was not granted enough memory to complete the operation and, hence, it spilled the results to tempdb to complete the entire sort operation there. This means the sort operation goes from a fast, memory operation to a slow, disk operation. To check how much memory was granted and how much was used, right-click on the SELECT operation and click Properties. A window will open on the right where you can find the Memory Grant Info
Let’s also hover our mouse over the arrow that leads to the sort operation.
Right – now that explains it. SQL estimated 414056 rows to match the criteria but we actually got back 1014056 rows back. This hints at outdated statistics.
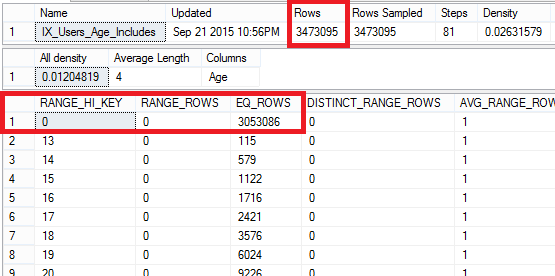
So what do our statistics look like:
DBCC SHOW_STATISTICS('Users', IX_Users_Age_Includes)Well, we can see that off the 3,473,095 rows, 3,053,086 have the age of ‘0’ – which leaves 420,009 for the rest of the ages. So clearly we have a statistics issue here.
First, let’s manually update the statistics with FULLSCAN.
UPDATE STATISTICS Users IX_Users_Age_Includes WITH FULLSCAN
And execute the query again. What does our execution plan look like this time.
Great – the warning is gone!
Let’s also look at the memory that was granted to us this time.
More… and rightly so. At this point it is worth noting that if your server is suffering from memory pressure you are not guaranteed to get the desired memory.
CONCLUSION
When a query is compiled, SQL Server estimates the memory required to execute it, and this is capped in stone when the query is executing. SQL Server does not look at the data in the table or index. It uses statistics to estimate the number of rows that will be returned and that will determine the execution plan. More memory is not granted if all of a sudden an operation returns more results than estimated. Therefore, it’s important that SQL Server has accurate statistics available to make a better estimate.
The post No thrills about spills appeared first on SQLYSE.


