

This is the sequel to “It’s always parameter sniffing (part 1).” In that post, we identified the stored procedure, and found a plan in cache that had some weird execution times.
This time, we’ll try to reproduce the issue in SQL Server Management Studio, and I’ll show why you need the SET options from the plan cache.
The setup
We’re using the stored procedure, QueryPostType, which takes a parameter of PostTypeId. In StackOverflow2010, the Post Type 1 has 1.1 million rows in the Posts table, and Post Type 3 has 28 rows.
The user calls in and tells us that they’re trying to find all the Post Types of 3, so it should be easy to reproduce, right? I’ll return statistics time to show you how long it took to execute on my machine.
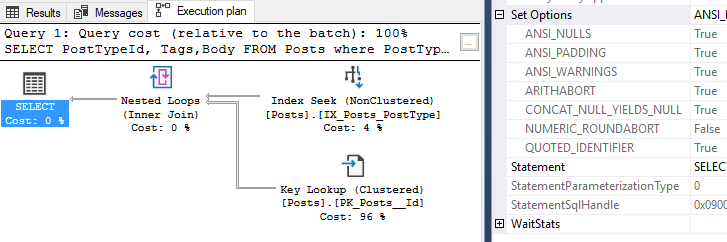
set statistics time on;
exec QueryPostType @PostType = 3;

-- SQL Server Execution Times:
-- CPU time = 0 ms,  elapsed time = 88 ms.
Based on those results, the query runs fast in SSMS. If you’ve been doing performance tuning for a while, you’re ready for this next statement.
The query runs fast in SSMS but slow in the app!
To me, that means that we didn’t get the right plan from cache. For some reason, our query didn’t retrieve a cached plan. It would be really nice if we could use the “RetrievedFromCache” value inside execution plans…but it’s just not reliable.
So what do we do now? In my opinion, our next step is to check the “SET” options. These are settings that users can change on their applications/connections, and they will give a separate execution plan when used.
Checking settings on the cached plan
Let’s check on our query’s settings in the execution plan, and then we can check on the plan in cache.
These are the settings and actual execution plan from the query above.
Now let’s query the plan cache and check out the plan in there. I’m returning the execution count too, see why in a second.
SELECT dm_plan.query_plan,
       stat.execution_count
FROM sys.dm_exec_procedure_stats as stat
CROSS APPLY sys.dm_exec_query_plan(stat.plan_handle) as dm_plan
WHERE object_name(stat.object_id) = 'QueryPostType'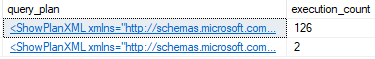
In this example, the plan with 126 executions is from the application. In the real world, that number could be much, much higher. Let’s open that plan and see what settings were used there.
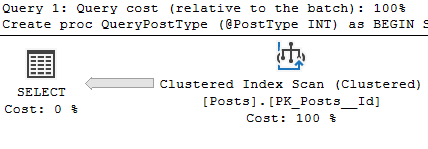
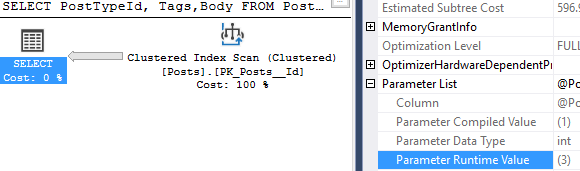
Here’s the plan it created, just in case you’re curious about the shape of the plan in cache.
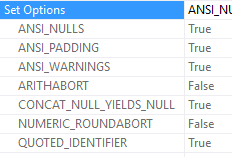
Arithabort was off in the application
This post isn’t about the “right” settings, it’s about retrieving the right plan from cache! Let’s go back to our previous example and turn it off, then hopefully we’ll retrieve the plan from cache.
SET STATISTICS TIME ON;
SET ARITHABORT OFF;
EXEC QueryPostType @PostType = 3;
-- SQL Server Execution Times:
-- CPU time = 1468 ms,  elapsed time = 1493 ms.
I’ve never been so happy to see parameter sniffing. And we even got the index scan plan.
I hope this was useful! This happened to me today and I had to find the SET options from the plan cache. Stay tuned.
