


Introducing: The SQLUndercover Inspector! Finally we have a V1 almost ready to hit our GitHub but what exactly is it?
Just another Monitoring tool? well not quite, the SQLUndercover Inspector is not really a Monitoring tool as such, parts of the Inspector can be used in this way if you choose to configure it that way but essentially its purpose is to provide you with a daily digest of information to allow you to keep up to date with the housekeeping of your server/s.
In a Nutshell:
The SQLUndercover Inspector is a configurable daily report written in SQL that will send you an email (or log the report to a SQL Table) showing you information about specific parts of SQL Server in HTML format including highlighted warnings/advisory conditions, the report has configurable thresholds and settings leaving you in control.
Long Version:
The SQLUndercover Inspector consists of 15 Modules:
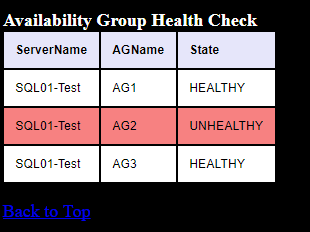
AGCheck – Show the health of your Availability groups, if unhealthy then highlight in Red and show a Warning Condition at the top of the report.
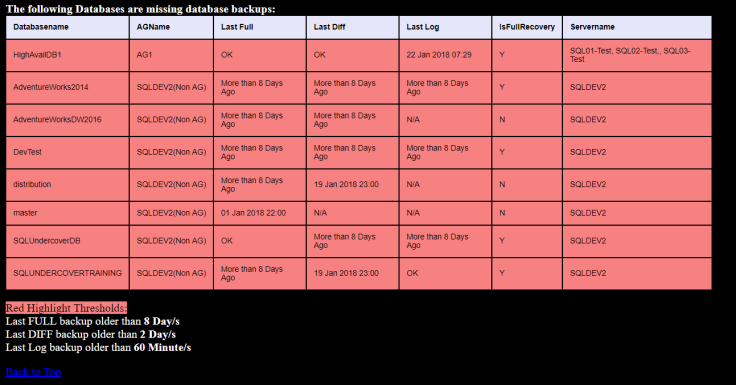
BackupsCheck – Check all backups for all databases including system databases (not TempDB) , compare the last backup dates for FULL, DIFF and LOG against the thresholds set in the Settings table, if there are any breaches then Highlight affected database/s in Red and Show a Warning Condition at the top of the report. If you take transaction log backups from Secondary replicas then the backupscheck will handle this too as long as you are running the collection on all servers taking backups (linked servers required to point to a central logging database) *
* This module can be set to run on a separate schedule so that you can conduct this check as frequently as you need.
Here is an example of backup issues shown by the inspector including one from an availability group , notice that the server name column includes all servers which can potentially take backups for the given database.
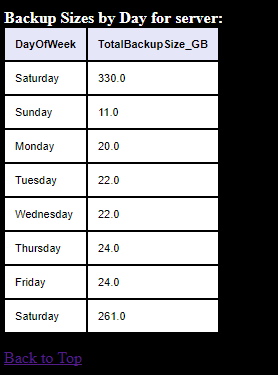
BackupSizesCheck – Show total backup size for Server/s broken down by Day of the week.
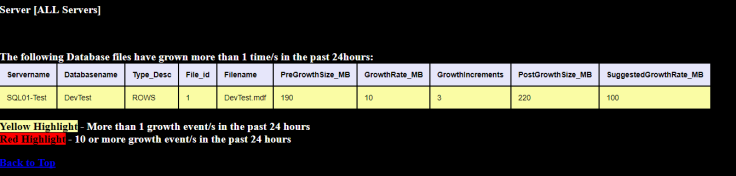
DatabaseGrowthCheck – Checks database data file sizes at collection versus sizes when last logged 24 hours ago , if the total growth increments exceeds the allowable growths per day threshold then you will see the file information highlighted in yellow and an Advisory condition is shown at the top of the report . If the total growths for a given file exceeds your maximum allowable growths threshold then the file information is highlighted in red and a Warning condition show at the top of the report.
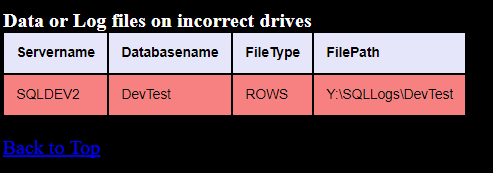
DatabaseFileCheck – Checks for Data Files on the Log drive and Log files on the Data drive, these drives are configured by the user during the Inspector setup. If any discrepancies are found then a Red warning condition will be added
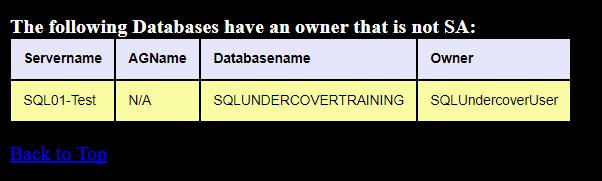
DatabaseOwnershipCheck – Checks ownership for all databases, if the owner differs from the logins specified in the settings table then highlight the information in yellow and show an advisory condition at the top of the report.
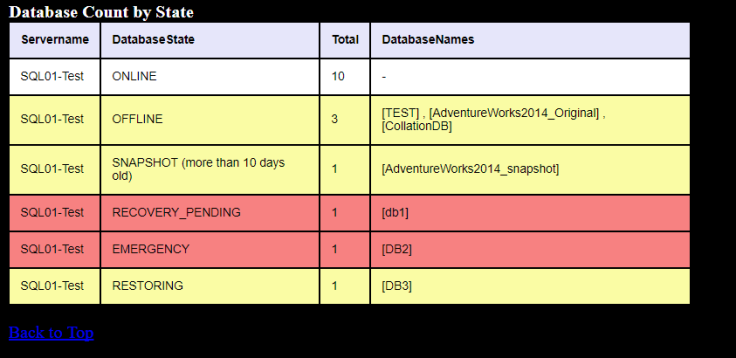
DatabaseStatesCheck – Checks the States of all databases as stored in sys.databases plus snapshot information , there are a few criterias for conditions based on the states as follows:
Yellow Advisories:
Restoring, Offline, Database Snapshots (more than 10 days old)
Red Warnings:
Recovery_Pending, Suspect, Emergency
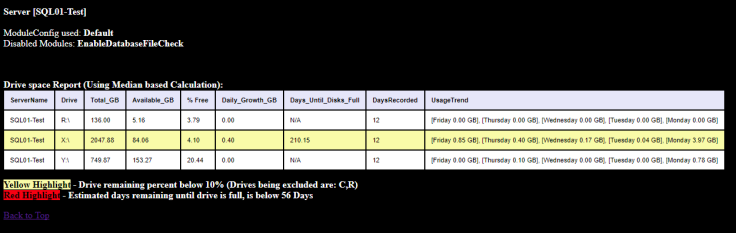
DriveSpaceCheck – Shows Drive information (drives which contain databases only) , Total capacity, Free space , Average daily data usage and the last five days usage.*
*Daily usage calculation has two modes, Average based calculation or Median based Calculation.
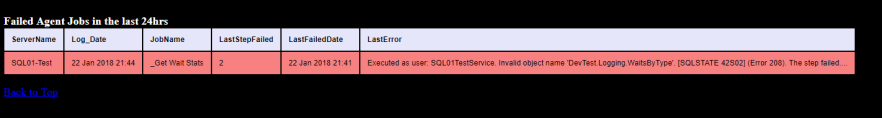
FailedAgentJobCheck – Check for failed agent jobs in the last 24 hours that have not succeeded since, any failures will be highlighted in Red and a Warning shown at the top of the report.
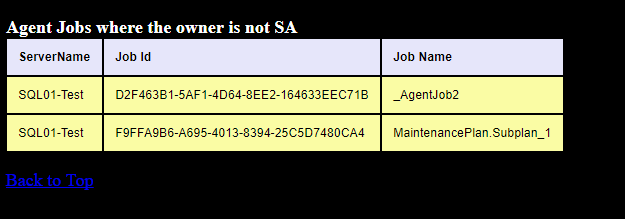
JobOwnerCheck – Checks SQL Agent jobs to ensure that all Job ownership matches the login/s in the settings table , any jobs which have a different owner are highlighted in yellow and an Advisory condition shown at the top of the report.
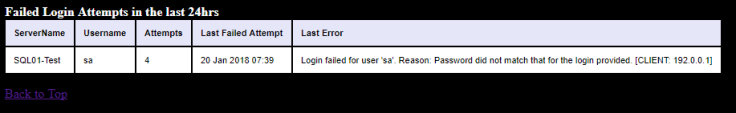
FailedLoginsCheck – Shows information on failed logins in the past 24 hours, shows the login name, failed count , last failed date time and the last error produced (No conditions apply to this module this is for informational purposes only).
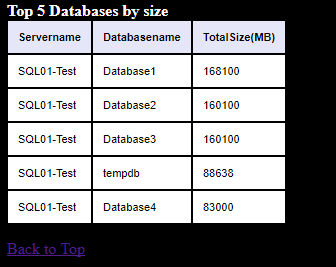
TopFiveDatabaseSizeCheck – Shows Database name and Size for the Top 5 Databases on the server ordered by Largest first (No conditions apply to this module this is for informational purposes only).
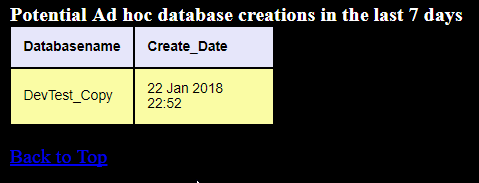
ADHocDatabaseCreationCheck – Checks for any databases that have been created in the last 7 days which include numerics in the database name or keywords ‘Restored’ or ‘Copy’ , any databases found matching the above criteria will be highlighted in yellow and show an advisory condition shown at the top of the report.
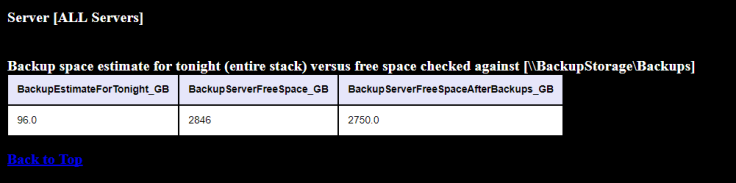
BackupSpaceCheck – Checks the space available on the backup drive specified in the settings table against the total estimated backup size required for the next 24 hour period, if there is insufficient space then the information will be highlighted in red and a Warning condition shown at the top of the report. *
*This modules using xp_cmdshell therefore it is possible to check network share storage.
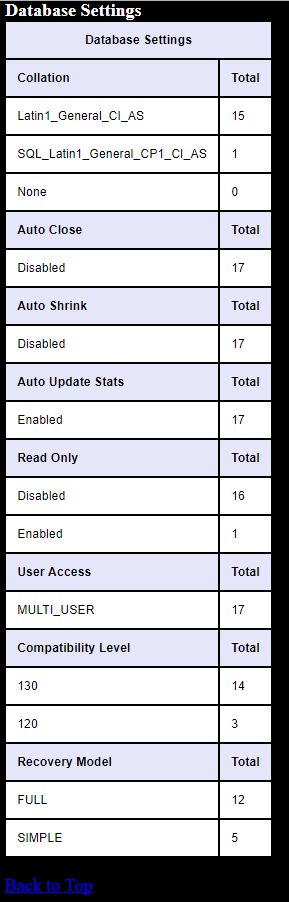
DatabaseSettings – Collect counts of Database settings for the following database settings:
Database Collation
Is_Auto_Close_On
Is_Auto_Shrink_On
Is_Auto_Update_Stats_On
Is_Read_Only
User_Access_Desc
Compatibility_Level
Recovery_Model_Desc
Yellow Advisory conditions are set to show if any of the following occur:
Is_Auto_Close_On = Enabled
Is_Auto_Shrink_On = Enabled
Is_Auto_Update_Stats_On = Disabled
All of the Modules described above can be Enabled or Disabled within the Modules table so its up to you what you want to see and what you do not want to see.
Modules or groups of modules can be set different configs, these configs can be used by the Report proc to run just the specified modules. By design there are two configs that come with the Inspector when you set it up ‘Default’ and ‘PeriodicBackupCheck’ the Default config is set to run all modules by default whereas the PeriodicBackupCheck only has the BackupsCheck Module enabled, you can add as many module configs as you like.
Settings/Thresholds:
The Settings Table contains the following configurable options:
SQLUndercoverInspectorEmailSubject – Set a custom Subject for the Email report (Default: SQLUndercover).
DriveSpaceRetentionPeriodInDays – Set how many days worth of Drive space information you want to retain in the DriveSpace table for Drive space calculations.
DriveSpaceDriveLetterExcludes – If you want to exclude certain drives from showing a Yellow advisory condition (% remaining on drive less than FreeSpaceRemainingPercent setting) then set it here as a comma delimited list.
FullBackupThreshold – If FULL Database backups are older than this many Days old then Highlight in Red and show a Warning Condition. This setting also controls how far back in days the Collection for the BackupsCheck Module will check for a FULL backup.
DiffBackupThreshold – If DIFF backups are older than this many Days old then Highlight in Red and show a Warning Condition. (Excludes system DBs).
LogBackupThreshold – If LOG backups are older than this many Minutes old then Highlight in Red and show a Warning Condition. (FULL Recovery databases Only also excludes system DBs).
DaysUntilDriveFullThreshold – N days to show a red warning condition for drive/s that been calculated that at the current usage rate will run out of space within e.g. Set to 56 to be warned when the drive/s will run out of space within 56 days.
FreeSpaceRemainingPercent – When the % free space on a drive falls below this number then highlight that drive in yellow and show an Advisory condition at the top of the report.
DatabaseGrowthsAllowedPerDay – Set number of Database data file growth events that you are happy with in a 24 hour period, when exceeded the file information will be highlighted in yellow and an Advisory condition added to the top of the report.
MAXDatabaseGrowthsAllowedPerDay – Set Maximum number of Database data file growth events that you are happy with in a 24 hour period, when exceeded the file information will be highlighted in red and a Warning condition added to the top of the report.
BackupsPath – Backup root folder e.g \\BackupStorage\Backups
EmailBannerURL – Want to use a custom image at the top of the Inspector report? Set the URL for the image here.
DatabaseOwnerExclusions – Login name for which all database ownership should be set to, any databases ownership’s that do not match this login will be highlighted in yellow and an advisory condition added to the top of the report.
AgentJobOwnerExclusions – Login name/s (Comma Delimited) which you are happy to have Agent job ownership, those that do not have these logins as their owner will be highlighted in yellow and an advisory condition added to the top of the report.
Agent Jobs:
The SQLUndercover Inspector creates four SQL Agent Jobs as follows:
SQLUndercover Inspector Data Collection – Collects data required for the Inspector Report.
SQLUndercover Inspector Report – Evaluate collected data and send HTML report via email, or log HTML output to the ReportData table.
SQLUndercover Periodic Backups Collection – Collects data required for the Periodic backups report.
SQLUndercover Periodic Backups Report – Evaluate collected backup data and send HTML report via email, or log HTML output to the ReportData table.
Typically I set the collections to run about 5 Minutes before the reports themselves but you may find that you can run them closer together depending on your requirements.
Here’s how a typical run will work:
- Data collection job starts – this job will check which modules are enabled for the current server and run just those specific data collections, this data is logged to the Inspector tables in a database of your choosing when you setup the Inspector for the first time.
- Report Job Starts – this job is responsible for evaluating all of the collected data for all servers which have collected data and set to Active in the CurrentServers table then send a HTML email to the email recipient/s in the EmailRecipients table or Insert a row into the ReportData table if the EmailRecipient is NULL or @TestMode = 1
In order to run for multiple servers you will need to have Linked servers in place that all point to your central database, this will also need to be specified in the setup phase of the Inspector as all of the statements are dynamically built during the setup, if you get it wrong don’t worry just simply run the setup again with the correct configuration.
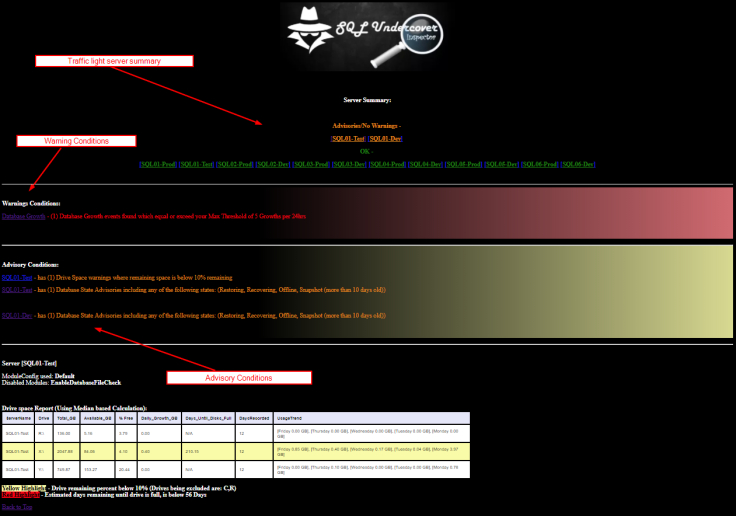
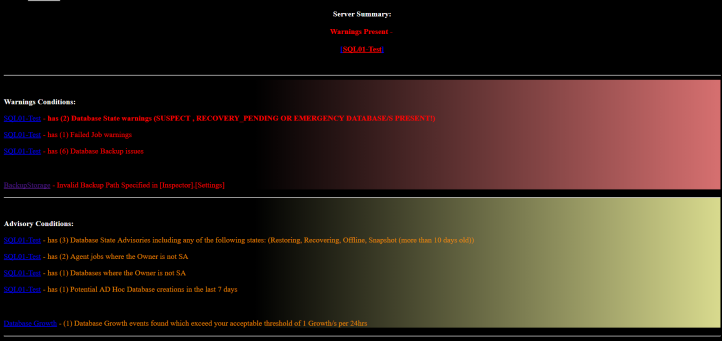
Below is an example of the Warning and Advisory conditions portion of the report from a single server showing some Red warning conditions and some Yellow advisory conditions:
Thanks for reading, keep your eyes open for a launch announcement 
