

By Steve Bolton
…………As recounted in the first installment of this occasional series of amateur self-tutorials, there are some serious limitations to using Waikato Environment for Knowledge Analysis (WEKA), a popular open source data mining tool, in a SQL Server environment. The documentation is full of white space and even thinner than that available for SQL Server Data Mining (SSDM); the Windows version runs only on the unstable and insecure Java Runtime Environment (JRE); as far as I can tell, there is no way to connect it to a SQL Server Analysis Services (SSAS) cube; perhaps worst of all, the user interface simply chokes on datasets of a mere few thousand records. This is compounded by the fact that any SQL Server they’re pulled from will run on one core when the interface crashes in this way, until the connections are killed in SQL Server Management Studio (SSMS) – which has the unexpected side effect of ending the WEKA process and the JRE (which must be rebooted before WEKA can be launched again). The WEKA process can’t even be stopped in Task Manager through ordinary means, since it runs through the JRE; this can be an issue, given that all of the analysis programs I’ve used to data have locked up under heavy loads at some point or another, no matter how professional or expensive they were. All this turns WEKA into a potential threat to server stability. Even when it runs correctly, a welter of other constraints further reduce its usefulness. The data types are less sophisticated than SQL Server’s by several orders of magnitude, given that it only supports nominal, strings, dates and relationals. The numeric subsumes all integer and continuous types, but as the documentation notes, “While double floating point values are stored internally, only seven decimal digits are usually processed.” We also have to resort to using an awkward Java filters package to perform ordinary tasks like partitioning and sampling datasets, which SQL Server users can perform instantaneously with SSMS GUI and T-SQL. There are few performance tools to speak of, except performing a few brute force, low-level actions like changing memory heaps sizes with arcane Java command prompts such as the -Xmx1024m parameter. Even garbage collection has to run manually in the WEKA Explorer, which is a function that the .Net Framework now implements quite well under the hood (finally, after several early Framework versions went by where Microsoft didn’t quite succeed). This article is not intended as a knock against WEKA though, because it does many legitimate uses, particularly in low-budget organizations that need free open source alternatives to high-priced software like SQL Server. This series is geared to an audience of SQL Server users though, most of whom will find it useful only in a much narrower set of use cases than the rest of the I.T. industry.
…………Given that SQL Server outmatches WEKA in every case where their functionality overlaps, it is much easier to ascertain its real benefits by a process of elimination. There are some fuzzy text capabilities, including the use such structures as stemmers and the like, but WEKA’s capabilities in this area don’t hold a candle to SQL Server’s Full-Text Search. There are many things SSDM and Analysis Services can do which WEKA cannot even do at all, like processing related tables and mining sequences.[1] Nor are there any neural nets or Time Series algorithms available out of the box. WEKA provides cross-validation capabilities like text-only confusion matrix and contingency tables to display true and false positives, but as usual, SSDM is simply several orders of magnitude better in this respect. These cross-validation components might come in handy, however, if we were using some of the unique algorithms that WEKA and its user community have provided. Furthermore, some of the unique functionality is pointless in a SQL Server environment. For example, using the Pattern command under Preprocess merely brings up a modal box titled Input, with the message, “Enter a Perl regular expression.” This is something SQL Server does not provide, for the sound reason that Perl scripting isn’t of much benefit in a .Net ecosystem; for that reason, we really can’t classify it as a “feature” in favor of WEKA.
A Comparison of Visualization Capabilities
…………I had high hopes for the WEKA’s visualization capabilities, given that there are so many types of infographics that no single data mining tool has yet implemented them all. Don’t underestimate the power of eye candy in analytics: yes, it is possible to misuse visualizations, especially as a marketing ploy of sorts to cover up a lack of content, but they serve a definite, no-nonsense purpose that saves time, energy and money. End users often don’t have the same level of experience in interpreting data that analysts do, nor do they have the time to acquire it, which is why they hire us; it is our job to communicate the information we’ve mined to the people who can act on it as efficiently as possible. This can sometimes be done more efficiently with graphics than numbers and equations, for as the saying goes, “a picture is worth a thousand words.” This is not precisely true in all circumstances, because sometimes words can convey a thousand pictures, but either way, imagery plays an indispensable part in human intelligence. This is a hard-coded, neurological consideration. Even an end user who understands the problem set quite well and are proficient in math and computer science can still benefit from them, given that every human brain still takes in most of its information visually; it quietly removes an unnoticed load even from the minds of experts and frees up their brains up to do other productive things, which there is no shortage of in the data mining field. I was glad to discover that WEKA indeed offers several types of plots, unlike some other open source tools, but they just don’t hold a candle to SQL Server’s capabilities. One issue with them is that they’re scattered throughout the interface, not concentrated in the Visualize Tab and Visualize menu as I expected.
…………The WEKA Explorer version of the user interface is some ways to superior to that of the Windows version of DB2, in that it at least works without constantly crashing, but it’s a little disjointed in this respect (and might possibly benefit from some mouse and hand-eye coordination testing of users in action, if such a thing is possible in the open source Java world). There are multiple types of scatter plots with slightly different capabilities, which are accessible through different components of the GUI, for example. The Preprocess Tab has a handy histogram in the bottom right corner, which is pretty, but also pretty small. As far as I can tell, the size and colors can’t be adjusted and hovering over different points doesn’t tell you much about the class an attribute is being compared to, as ToolTips do in SSDM and Reporting Services. The Visualize All button can be used to display all of the histograms for every attribute in one fell swoop in a separate window, but none of this is really special in comparison to the capabilities of Reporting Services. As I demonstrated in Outlier Detection with SQL Server, Part 6.1: Visual Outlier Detection with Reporting Services, histograms are fairly simple to code right in SQL Server, with the added benefits of flexibility, customization and capacity for displaying large datasets. In the same vein, the WekaManual.pdf contains a screenshot of a 3D Scatter Plot that can be implemented through the Perspective menu command in the Knowledge Flow GUI, but it’s only eye-catching because of its black background; there’s nothing there that an SSRS developer couldn’t whip together in a jiffy.[2]
The visualization methods available through the GUI menu are barely mentioned in a single bulleted list in the.pdf, which is a shame given that I ran into issues with all of them except the Plot command. Various GUI controls are available with the scatter plots to adjust the jitter, diagram size, point size, colors, scrolling speed and sampling percentages, but it’s nothing that can’t be coded in Reporting Services. I had trouble figuring out what the ROC Displays command did, given that it simply brought up the same window as the Plot command for each sample dataset I tried. I discovered that it is an abbreviation for “Receiver operating characteristic,” whatever that is. Although I complained frequently in A Rickety Stairway to SQL Server Data Mining about the quality of the SSDM documentation and wrote my first series, An Informal Compendium of SSAS Errors, in order to address the lack of published information on that topic, I was unprepared for just how thin the WEKA documentation is in spots. I had a difficult time tracking down any citations at all that might help me figure out what I was doing wrong with ROC Curves. All I turned up is in a mention of ROC Curves in the separate KnowledgeFlow component; given that this is an item on the startup window’s menu bar, there ought to be at least some immediately accessible mention of it in the documentation. The TreeVisualizer is apparently used for displaying directed graphs defined in GraphViz’s .dot format, such as the output of tree classifiers available in WEKA’s J48 and M5P packages.[3] Unfortunately, the TreeVisualizer didn’t respond when I loaded various sample .dot files I found on the Internet into it. Likewise, the GraphVisualizer is supposed to display Bayesian networks encoded in.xml, .bif and .dot files[4], but none of the .bif sample documents I downloaded from the Bayesian Network Repository produced any output. Also, the blue bar got stuck on “Removing gaps by adding vertices” about a quarter of the way through when I set the LayoutType to Naive instead of Priority and checked Edge Concentration. I’m not saying that that my own naiveté isn’t the culprit here, especially since I barely gave this functionality a cursory check-over. Nevertheless, a quick search of the Internet uncovered posts by other users who have had the same problem. I’m simply not going to get into writing Java in command prompts or inspecting the sample files for EOF or Unicode characters, as the various workarounds require. It’s a shame it doesn’t work out of the box, given that visualization of Bayesian networks might address some use cases that SSDM’s Naïve Bayes algorithm does not. In fact, WEKA has some distinct advantages in terms of Bayesian data mining, in that Chapter 9 in the documentation is devoted to the topic and some good information is also available for using the Bayes Net Editor, which can be accessed from the Tools menu in WEKA Explorer. Except for the broken GraphVisualizer, the BoundaryVisualizer probably exposes the most functionality not found in SSDM, where the emphasis is on using trees to depict how classifiers discriminate between data points. The plot in Figure 1 could easily be coded in Reporting Services though. The same can also be said for the sample bar charts and scatter plots in Figures 2 through 4.
Figure 1: The WEKA Boundary Visualizer
Figure 2: Sample Bar Charts from WEKA’s Preprocess Tab
Figure 3: Screenshot of the WEKA Plot Command
Figure 4: Example of a WEKA Scatter Plot Matrix
…………The BoundaryVisualizer and Bayes net functionality brings us to the topic of the actual mining functionality that leads to these outputs. In many respects WEKA overlaps SSDM, in which case it is invariably wiser to go with the latter, but it implements a few algorithms and parameters that SQL Server does not. For example, WEKA users can perform Association Rules mining with the Apriori and FilteredAssociator algorithms, which will return various metrics like Confidence, Conviction, Lift and Leverage in its output. This would only be beneficial in a low-budget, non-SQL Server environment though, given that the output in Figure 5 is far more difficult to decipher than SSDM’s output for similar algorithms, as depicted in A Rickety Stairway to SQL Server Data Mining, Algorithm 6: Association Rules. As I mentioned in that article, Association Rules is a brute-force method of data mining that can be computationally intensive, to the point where the parameters require a lot of tweaking to prevent SSDM from crashing. I seriously doubt that WEKA can handle the kind of half-gigabyte datasets I crammed into the SQL Server version of Association Rules for that article, given that it has so much trouble just displaying 5,500 records in it SQLViewer.
…………Clustering is far less taxing on server resources than Association Rules, as I noted in A Rickety Stairway to SQL Server Data Mining, Algorithm 7: Clustering, so it would probably be a safer bet to explorer WEKA’s capabilities using this set of mining methods from the Cluster Tab. On the other hand, it suffers from an identical problem: as shown in Figure 6, it only outputs text, not any visualizations comparable to the Microsoft Cluster Viewer. This is a more serious drawback than with Association Rules, since Clustering is inherently visual. The good news is that besides the Expectation Maximization (EM) and K-Means brands of clustering available in SSDM, WEKA also provides others like Canopy, Cobweb, FarthestFirst, FilteredCluster, HierarchicalClusterer and MakeDesnityBasedClusterer that aren’t available out of the box in SQL Server at all. If a client came to me with a special need for one of these flavors of Clustering on a small dataset, I’d first try running it through WEKA. Another advantage is that it the Cluster Tab makes a broader list of parameters available than SSDM does for its two Clustering algorithms (plus Sequence Clustering, which WEKA doesn’t offer).
Figure 5: Sample Output for Association Rules in WEKA (click to enlarge)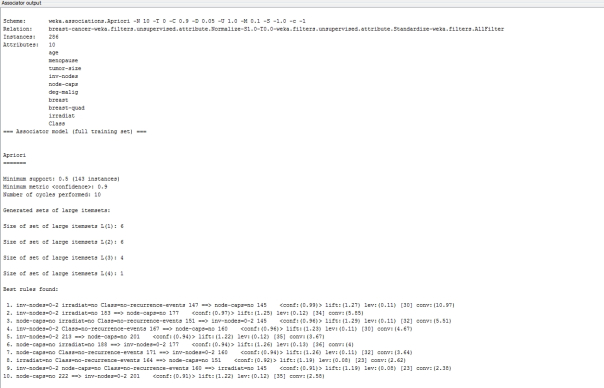
Figure 6: Sample Output for EM Clustering in WEKA (click to enlarge)
…………The same general principle applies to other aspects of WEKA: it’s mainly useful to SQL Server users in cases where 1) it has functionality that is not implemented in SSDM; 2) the same functionality couldn’t be quickly coded in an economical way in T-SQL, Multidimensional Expressions (MDX) or SSDM plug-ins; 3) the problems it solves aren’t encountered frequently enough to justify buying a different professional tool that does the same job; and 4) WEKA proves capable of processing the number of required rows without choking, which is a big if. Another area where these four conditions might be met is in feature selection, which is taken care of through the Select Attributes Tab. There are options available here which appear (at least from their names) to go beyond what SSDM offers in some respects, like GainRatioAttributeEval, InfoGainAttributeEval, CfsSubsetEva;, CorrelationAttributeEval, OneRAttributeEval, PrincipalComponents, ReliefAttributeEval, SymmetricalUncertAttributeEval and WrapperSubsetEval. The Search Method Choose button also contains choices not available out-of-the-box in SSDM, like BestFirst, GreedyStepwise and Ranker. Once again, however, the benefits might be canceled out by WEKA’s inability to process “Big Data”-sized datasets, which necessitates far more stringent thresholds for feature selection than tools like SSDM; assessing how many attributes a data mining tool can process becomes a whole different ballgame when we know in advance that it can only handle a few thousand rows of input. As usual, any benefit for SQL Server users is going to be found in the fine-grained control made possible by specialized parameters, but these will only prove useful in a really narrow set of use cases. In fact, WEKA’s weak processing capabilities may nullify the value of its additional feature selection choices altogether.
Figure 7: Sample Output from the WEKA Classifier (click to enlarge)
…………The WEKA Classifier Tab is likely to be of more benefit to SQL Server users than any of the aforementioned components, save perhaps for the Bayes Net Editor and other Bayesian functionality SSDM doesn’t have. SSDM includes some solid classification methods out of the box, like Decision Trees, Naïve Bayes and Microsoft’s Neural Network Algorithm. Nevertheless, end users might find a use for the six classifiers WEKA provides, ZeroR, DecisionTable, Jrip, OneR, PART, MSRules (which was always greyed out during my trial), all of which have their own unique sets of parameters. I’m not sure what the use cases for all of them are – there are literally thousands of data mining algorithms out in the wild today, so I’m sure that even experts can’t match them all up – but if the need should arise for one of them, WEKA might be a good starting point. Provided, that is, that we’re speaking of small datasets, which represent an omnipresent caveat. In Figure 7, we can see that the Classifier returns only text output, like the crude Confusion Matrix. The real story, however, is the extra information provided by the Kappa statistic, Mean absolute error, Root mean squared error and the like, none of which are returned by SSDM or SSAS. I now know how to code many of these myself in T-SQL and would probably prefer to do it that way, particularly when datasets of more than a few thousand rows are at stake.
…………One of the few scenarios SQL Server users might have for accessing the WEKA KnowledgeFlow Environment is to automate ETL loading and extraction for the functionality SQL Server doesn’t have, like certain aspects of the Classifier Tab, the Bayes Net Editor and some of the Clustering algorithms. For example, fine-grained control of the unique parameters and algorithms available in WEKA can be automated, but I won’t go into much depth on this topic because it applies mainly to an even rare set of use cases, for organizations which need to use SQL Server and WEKA together on a continual basis. Furthermore, the minor league documentation is thin, even when all of the white space isn’t taken into account. SQL Server Integration Services (SSIS) simply blows it away – as it should, considering that WEKA and its KnowledgeFlow is free. One of the few noteworthy differences is that the available data sources and destinations include Matlab, JSON, SVMLight, .xrff, serialized and LibSVM formats, in addition to the .csv and text formats included in SSIS.
The Silver Linings: WEKA’s User Community and Extensibility Architecture
…………Other automation capabilities are available through an API[5], at least for those with a taste for Java. Yet the real benefits to SQL Server data miners can be found in WEKA’s Extensibility interface, which allows us to take advantage of the hundreds of add-ons developed by the WEKA user community. This is where WEKA really shines, especially since Microsoft quit upgrading SSDM’s algorithms back in SQL Server 2008 R2, as I lamented often in the Rickety tutorial series. Last time I checked, there were 116 add-on packages available at the WEKA website, covering everything from Arabic stemmers to alternating Decision Trees to a Radial Basis Function (RBF) neural net, which might be of interest to me. Some of these were repeated in the list of 369 available at SourceForge’s page for WEKA packages. The sheer number of add-ons should be a clue that they come from many highly specialized fields and are thus beyond any one person’s powers of comprehension and description. It’s a good idea to know precisely what algorithm you need for the job at hand prior to diving into the pool of packages, especially since many of them have inscrutable names and terse descriptions which are probably only clear to the initiated and the enlightened. WEKA is not like SSDM, where you can go in blind and untrained and still get grope your way towards meaningful results; you have to know exactly what these WEKA packages do and why they do it, which is something I couldn’t do with SSDM’s algorithms when I started the Rickety series. The omnipresent caveat of small dataset sizes also hangs like a pall over WEKA add-ons, like a dark cloud over a silver lining: don’t assume that any of these packages are any better at handling larger datasets than WEKA itself is, especially since they’re often written by just a single user. I strongly suspect that many of them haven’t been subjected to any stress tests at all, since I’ve never seen the subject come up in any of the discussions, documentation or description of WEKA packages. Since the SQLViewer alone is capable of locking up SQL Server on one core, there is no telling what these open source add-ons might do if we run them with SQL Server connected. Unlike the JRE, I doubt that they represent security holes, but they might lead to performance issues and crashes. After all, we are talking about Java here, which is not in the same league of reliability as .Net. Just because the WEKA add-on packages might occasionally prove useful to SQL Server users doesn’t mean I’d ever waste time trying to code one in Java myself, based off of the weka.classifiers.AbstractClassifier class. Chapters 18 and 19in the WekaManual.pdf can get intrepid Java die-hards started with writing their own classifiers, associators, filters and the like, but it really only makes sense if you’re already both an experience SQL Server user with an advanced Java skillset to boot, plus are faced with narrow classes of mining problems. It would otherwise be several orders of magnitude easier for someone used to the Microsoft ecosystem to write T-SQL routines, SSDM plug-ins or .Net code, perhaps with the aid of the Accord Nuget package. It may likewise be possible to upgrade the GUI and augment WEKA with graphics functionality from the Prefuse Visualization Toolkit – but why bother, when we can do so much more, at a much faster pace and in a much more reliable way with Reporting Services and Windows Presentation Foundation (WPF) interfaces?
…………If I had the option, I would try to meet the data mining needs of clients through SSDM, SSAS, Reporting Services, in cases when SQL Server provides the same functionality as WEKA. This leaves the existing add-on algorithms, the Experimenter, the Bayes Net Editor, some of the functionality on the Classifier Tab and some of the Clustering algorithms as the most useful aspects of WEKA, at least in a SQL Server environment. I originally figured that parsing .arff and .xrff files might be among these narrow use cases, but it turns out that they can be easily converted and imported into SQL Server, seeing that they’re basically just text and xml; I’m not yet certain about the .bif and .dot formats also used by other WEKA components though. Of course, these remaining use cases are further narrowed by the fact that WEKA simply can’t handle datasets of the size that DBAs are accustomed to working with every day, let alone SSAS cubes and SSDM mining models. For these scenarios, we have no choice but to turn to custom SQL Server and .Net code or other third-party mining tools. I’m presently trying to acquire the skills to translate the underlying math formulas for many other algorithms not included with SSDM, and in some specialties where I’ve made a little progress, like fuzzy sets, neural nets and various measures of information, I’d prefer concocting my own custom T-SQL and Visual Basic solutions (possibly in conjunction with Accord, which I haven’t had the time to try yet). As the saying goes, Your Mileage May Vary (YMMV): other SQL Servers users may have far more experience in other Microsoft languages or other math formulas and concepts, so the scenarios where custom code is an option could vary wildly from one development team to the next. It might also pay to look at one of the other tools I plan to cover in this occasional series in coming years, like RapidMiner, R, Pentaho, Autobox, Clementine, SAS and last but not least, Predixion Software, which was started by former SSDM developers like Jamie MacLennan and Bogdan Crivat. I’ve already dispensed with two of SQL Server’s main competitors in Thank God I Chose SQL Server part I: The Tribulations of a DB2 Trial and Thank God I Chose SQL Server part II: How to Improperly Install Oracle 11gR2.
…………My criticisms of WEKA may come across as harsh, but I was actually quite surprised at how well it worked for a free tool; for data miners with no budgets and no access to SSDM, it might be the perfect solution. In fact, IBM and Oracle really ought to be embarrassed by the fact that WEKA behaved better in many respects than the Windows versions of their expensive data mining suites. As I often said in my Rickety series, SSDM is still a really good tool in comparison to its competitors, despite a decade of neglect by Microsoft. If a development team were thinking of trying to save a few bucks by using WEKA instead of SSDM I’d strongly advise against it, because the hassle, training time, debugging, inevitable crashes and other intangibles would probably wipe out the supposed savings quite quickly. These intangibles would weigh even more heavily with DB2 and Oracle, which were less professional than WEKA in many respects; no matter how expensive a data mining suite is, it isn’t worth a thing if the installers and user interfaces are so riddled with careless errors that it won’t launch or stay running. Judging from how frequently the same “gotchas” were reported by experienced DB2 and Oracle users, my misadventures with those two products were less indicative of novice errors than corporate rot leading to real declines in software quality. For that reason, I had no idea what to expect when I tried Minitab, a moderately expensive data mining tool that can nonetheless meet certain use cases that SQL Server cannot. As we shall see in the next installment, I was pleasantly surprised by how well it worked, especially in fields hat SSDM and SSAS don’t cover at all, like Analysis of Variance (ANOVA) and experiment design. That cuts further into the use cases for WEKA Experimenter and Classifier Tab, which I’d prefer to use Minitab for, provided I had enough clients with those specific needs to justify the costs. I look at the analytics marketplace not as a hierarchy of bigger and smaller fish, but more as a toolbox in which everything has its proper place. In recently learned that the mathematical research and available algorithms far outstrips the available software, probably by a factor of several dozen to one; the theoreticians are literally decades ahead of the marketplace, which means no data mining tool is even close to incorporating them all. The analytics marketplace is going to be wide open for a long time to come. The lesson I’ve learned is that anyone hoping to succeed in the analytics field can benefit from familiarizing themselves with as many tools as possible, as well learning to code their own on the fly as quickly as possible. For the foreseeable future, I hope to inch towards both goals on dual tracks, by writing this occasional series alongside tutorial series like Outlier Detection with SQL Server.
[1] See the Wikipedia article “Weka (Machine Learning)” at http://en.wikipedia.org/wiki/Weka_(machine_learning)
[2] p. 117, Bouckaert, Remco R.; Frank, Eibe; Hall, Mark; Kirkby, Richard; Reutemann, Peter; Seewald, Alex; Scuse, David, 2014, WEKA Manual for Version 3-7-11. The University of Wakaito: Hamilton, New Zealand.
[3] IBID., p. 237.
[4] IBID., p. 32.
[5] IBID., p. 205.

![]()
