

By Steve Bolton
…………I kicked off this far-ranging series on using SQL Server to quantify information by discussing two of the earliest and most important measures, the Hartley function and Shannon’s Entropy. These foundations of information theory are intimately related to a more general measure, Rényi Entropy, which is a bit more complex but nonetheless worthwhile to discuss, since its unites many different information measures under one umbrella. The underlying math formula isn’t much more difficult than the one for Shannon’s Entropy I posted last time around, but its alpha parameter (a-parameter) enables it to give rise to a wider range of results. This assortment of entropy types can be adapted to solving a wider range of problems.
…………A general-purpose means of parameterizing the concept of entropy was the explicit goal of Alfréd Rényi (1920-1971), a mathematician who overcame anti-Semitic persecution at the hands of Hungary’s World War II regime, which was allied with the Nazis and passed stringent laws against their own Jewish minority. Incidentally, his coffee addiction was the inspiration for the colorful saying, “A mathematician is a device for turning coffee into theorems”, which apparently predates the saying, “A programmer is a machine that turns coffee into code.”[1] The formula that bears his name has proven useful in many diverse fields and industries, from quantum mechanics to fractals to ecology and statistics, where it is useful in deriving indices of diversity.[2] When the a-parameter is set to 2, it becomes Collision or Quadratic Entropy (or sometimes just “the Rényi Entropy”), which “has been used in physics, in signal processing and in economics” and is attractive to statisticians because they “have found an easy way to estimate it directly from samples.”[3] Given that it has multifarious uses and is both easy to explain and compute in SQL Server, it makes sense to add it to our toolbelt, in order to derive our own DIY data mining methods. One thing I’ve come to realize since writing my initial A Rickety Stairway to SQL Server Data Mining tutorial series awhile back is that the data mining marketplace is decades behind the research in some respects, to the point where all of the available software taken together is probably several orders of magnitude behind the formulas available in the math books. If we encounter situations where the particular algorithms that would work best for our use cases aren’t yet implemented, waiting might not be an option, and if we’re going to learn to build our own, Rényi Entropy is bound to come in handy at some point.
Coding the Range of a-Parameter Values
The key to understanding Rényi Entropy is grasping how it intersects with its cousins. The a-parameter can be any non-negative value except for 1, which would result in a divide-by-zero error since one of the terms is 1 / (1 – a). This result is multiplied by a logarithm taken on the sum of the probabilities taken to the power of a; this differs from Shannon’s famous equation in that his log operation is performed on each probability and then multiplied by that probability, then summed afterwards and multiplied by -1. This logic is all implemented in the INSERT operation in Figure 1, in which most of the code is devoted to deriving actual probability values from the proportions of a single float column, taken from the same Higgs Boson dataset[4] I’ve been using for practice purposes for the past few tutorial series. I omitted any display of the intermediate proportions stored in the @EntropyTable variable, since they’re identical to the sample results posted in last week’s article. Evidently, it’s economical to compute these entropies, given that this code takes less than 2 seconds to run on my ancient abacus of a development machine (I might as well be using quipus) and most of that was devoted to deriving the probabilities for all 11 million rows; if we already had probability values derived from some other source like estimates, sampling or deductive methods, it would run practically instantaneously. I also hard-coded the results we already calculated over the last two articles for the Hartley and Shannon Entropies, given that they are also unchanged. The final SELECT in Figure 2 provides the same information from another vantage point, by plugging a range of a-values rather than a single parameter into the Rényi formula.
…………Note that as the values approach 1, they converge towards the Shannon Entropy, although they can never quite reach it because of the divide-by-zero error that would occur if plugged in the forbidden parameter value of 1.Likewise, the return values approach the Hartley measure as the parameter values approach 0; this acts as a cap on the permissible values, hence the frequent use of the synonym Max Entropy. Because SQL Server’s calculation powers are impressive yet finite, we can’t plug in values approaching infinity (if such a thing were possible). In fact, we can’t even go much higher than a-values of about 50 (which are rarely used in practice anyways) on this particular dataset without getting floating point errors. Figure 3 is sufficient to nevertheless sufficient to illustrate how the Rényi results approach an information measure known as the Min Entropy, which acts as a cap on the other end. References to it as the Chebyshev Entropy[5] seem to be few and far between outside the realm of quantum physics, but I’ve run into a few here and there. It is nonetheless easy to calculate, given that all we have to do is find the maximum probability value and take the negative log. As Wikipedia points out quite succinctly, “The min entropy is never greater than the ordinary or Shannon entropy (which measures the average unpredictability of the outcomes) and that in turn is never greater than the Hartley or max entropy, defined as the logarithm of the number of outcomes.”[6] It is also useful as the “most conservative way of measuring the unpredictability of a set of outcomes,” a property that makes it useful in determining randomness and quantum cryptography, in a way that the Shannon Entropy can’t handle.[7] Each Rényi value in between the fences set by the Min, Hartley and Shannon Entropies has its own distinct uses in ascertaining “the unpredictability of a nonuniform distribution in different ways.”[8] We can thus choose whatever a-parameter is ideal for dealing with the particular distribution of our data. As an amateur, I’m lacking in the experience needed to determine which a-values are best-suited to specific problems, but this code at least provides a launching pad for exploring such questions.
Figure 1: The Rényi Entropy in T-SQL
DECLARE @LogarithmBase decimal(38,36) = 2 –2.7182818284590452353602874713526624977 — 10
DECLARE @AlphaParameter decimal(38,35) = 2
DECLARE @Count bigint, @DistinctValueCount bigint, @RenyiEntropy float, @MinOrChebyshevEntropy float
SELECT @Count = Count(*)
FROM Physics.HiggsBosonTable
WHERE Column1 IS NOT NULL
DECLARE @EntropyTable table
(Value decimal(33,29),
ValueCount bigint,
Proportion float,
SummationInput float
)
INSERT INTO @EntropyTable
(Value, ValueCount, Proportion, SummationInput)
SELECT Value, ValueCount, Proportion, Power(Proportion, @AlphaParameter) AS SummationInput
FROM (SELECT Value, ValueCount, ValueCount / CAST(@Count AS float) AS Proportion
FROM (SELECT Column1 AS Value, Count(*) AS ValueCount
FROM Physics.HiggsBosonTable
WHERE Column1 IS NOT NULL
GROUP BY Column1) AS T1) AS T2
SELECT @RenyiEntropy = 1 / (1 – @AlphaParameter) * Log(SUM(SummationInput), @LogarithmBase), @MinOrChebyshevEntropy = –1 * Log(Max(Proportion), @LogarithmBase)
FROM @EntropyTable
SELECT @RenyiEntropy AS RenyiEntropy, @MinOrChebyshevEntropy AS MinEntropy, 13.2879304339032 AS ShannonsEntropy, 14.772263018717 AS HartleyOrMaxEntropy
Figure 2: A Range of Sample T-SQL
–WHOLE RANGE OF RENYI ENTROPY
SELECT AlphaParameter, 1 / (1 – AlphaParameter) * Log(SUM(Power(Proportion, AlphaParameter)), @LogarithmBase) AS ResultingRenyiEntropy
FROM (VALUES (0.01), (0.5),(1.01),(2),(3),(4),(5),(10),(50)) AS T1(AlphaParameter)
LEFT JOIN @EntropyTable AS T2
ON 1 = 1
GROUP BY AlphaParameter
ORDER BY AlphaParameter
Figure 3: Results from the Higgs Boson Dataset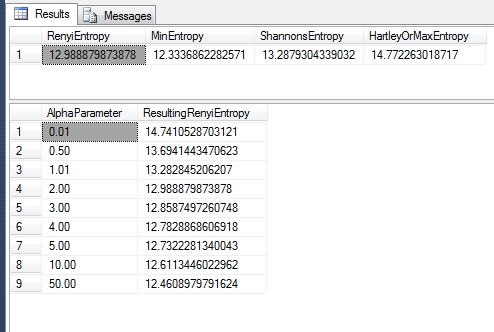
…………Jose C. Principe, a neural net expert who teaches at the University of Florida, has written a handy 35-page guide to using the Rényi Entropy for tasks even further beyond my level of inexpertise, such as deriving measures like Information Potential based on probability distribution function (PDF) estimates. This quickly leads into the bleeding edge topic of information geometry, which I won’t touch with a ten-foot pole for a few more years, at least until I have a better understanding of such mind-blowing concepts as statistical Riemann manifolds and multidimensional spaces. The introductory pages are nevertheless useful in illustrating how Rényi Entropy works on simpler expressions of information. This is particularly true of the excellent diagram on the page 4, which shows how the various a-values measure the distance of a PDF to the origin point, thereby filling in the available space for information content in different proportions. As we shall see later in this series of self-tutorials, plugging different a-values into a related concept known as the Rényi Divergence also allows us to measure the distances between two PDFs in various ways. This is intimately related to the Kullback–Leibler Divergence in much the same way as the Rényi Entropy is related to the Shannon Entropy. The KL-Divergence is among the most important measures in information theory and related fields so I’ll be writing quite a bit on the subject later on in the series, as I did with the Shannon Entropy in the last article. It also goes by the name of Relative Entropy, but I’ll have to put off that discussion for a later time, when I can set aside a separate segment of the series for distance and divergence measures between probability distributions. Over the next four articles I’ll stick to the topic of entropy measures on single distributions, including Leaf and Root Entropy, which are inextricably related to the SSDM algorithm I covered in A Rickety Stairway to SQL Server Data Mining, Algorithm 3: Decision Trees.
[1] See the Wikipedia page “Alfréd Rényi” at http://en.wikipedia.org/wiki/Alfr%C3%A9d_R%C3%A9nyi
[2] See the Wikipedia article “Rényi Entropy” at http://en.wikipedia.org/wiki/R%C3%A9nyi_entropy
[3] pp. 6-7, Principe, Jose C., 2009, “Rényi Entropy,” course notes posted at the University of Florida webpage http://www.cnel.ufl.edu/courses/EEL6814/renyis_entropy.pdf
[4] I downloaded this publicly available dataset from University of California at Irvine’s Machine Learning Repository and while back and converted it to a SQL Server table, which now takes up about 5 gigabytes in a sham DataMiningProjects database.
[5] One source I found it mentioned in was Bengtsson, Ingemar, 2008, Geometry of Quantum States: An Introduction to Quantum Entanglement. Cambridge University Press: New York.
[6] See the Wikipedia article “Min Entropy” at http://en.wikipedia.org/wiki/Min_entropy
[7] IBID.
[8] IBID.
