

By Steve Bolton
…………I’ve written several amateur tutorial series on this blog in order to more quickly absorb difficult data mining, statistical and machine learning topics, while hopefully helping other SQL Server users avoid some of my inevitable mistakes. Since I don’t know what I’m talking about, I’m occasionally surprised at how useful some of the material turns out to be – particularly in the case of this week’s topic, fuzzy numbers, which I originally thought were a curiosity. In recent years I’ve made moderate progress in recapturing some of the advanced math skills I had as a kid, but some of the resources I’m consulting still wear me out with densely packed, arcane symbols; that was also true of George J. Klir and Bo Yuan’s Fuzzy Sets and Fuzzy Logic: Theory and Applications and several other sources I’ve used for this series on using T-SQL to implement fuzzy sets. Much of the literature on the subject is written by mathematicians who need thick equations and highly precise terminology to communicate with each other effectively, which can be taxing on non-specialists not accustomed to the jargon of the field.
…………That communication gap may be responsible for the enormous lag between the refinement of the theory and its adoption; this comes despite all of the empirical evidence that these data modeling techniques are insanely useful in solving certain classes of real-world problems, in a wide variety of industries. Adoption has also lagged in the relational database and data mining markets, in spite of the fact that set-based languages like T-SQL and Multidimensional Expressions (MDX) are ideal for implementing fuzzy sets. I’m trying to put my drop in the bucket to remedy that, but my lack of adequate equation translation skills almost caused me to skip over fuzzy numbers, which are actually one of the simplest and most useful aspects of fuzzy set theory.
Modeling Everyday Speech
…………One rule of thumb I’ve learned along the way is that whenever confusion arises over fuzzy sets, it is best to return to basics and state the problem in terms of natural language. After all, the main overarching use case for fuzzy set theory is to model imprecision that can be expressed linguistically, particularly when it would be useful to use continuous scales to ordinal categories. If we were using a Behavior-Driven Development (BDD) methodology, we might want to flag any qualifiers we encounter in user stories like “about,” “around,” “near,” “approximately,” “most,” “few” and the like as candidates for fuzzy numbers. These require several numbers and calculations of various intensity in order to assign a range of values to a single number – but since ordinary numbers require none of this extra computation, the obvious question is, why bother? It turns out that these particular instances of fuzzy sets are useful in modeling these types of natural language qualifiers, which express uncertainty about how close a value is to a definite target value.
…………“About half” is a clear and simple example from everyday speech. In fuzzy set parlance, this would be modeled as a “triangular number,” which is a fancy way of saying that we’d assign a perfect membership grade of 1 to values that were exactly equal to 0.5, but descending on either side of 0.5 in proportion to how far away the value was from that target. The term “triangular” is used because if we use a line chart to depict a membership function of this kind, it peaks at the target value and descends to 0 as the values decrease or increase away from it. Trapezoidal numbers are a mouthful, but really aren’t much more difficult; they have basically have the same shape as triangular numbers, except that the peak is flattened in order to express an interval of some kind.[1] University of Minnesota Prof. Glen Meeden’s natural language example of a trapezoidal number is the best I’ve yet run across in the literature: “What is the average yearly snowfall in the Twin Cities? You might answer somewhere between 20 and 50 inches.”[2]
…………Functions that only increase or decrease are useful in capturing related distinctions, like “a large number of” or “a small number of.”[3] Although it is wise to obey a few restrictions that lead to certain useful mathematical properties – particularly the industry-standard requirement of a boundary between 0 and 1 – it is not necessary for the membership functions to be symmetric. In fact, assigning a lopsided peak to a triangular number can be useful in modeling statements like “almost all,” which would be closer to the right edge of a line graph than a function that implements the term “most.”[4] They can even be bell-shaped.[5]
…………At a higher level of sophistication, fuzzy numbers can be used to model terms like “very,” which fall under the rubric of linguistic hedges and fuzzy modifiers – including statements like “very true,” which can be useful in fuzzy logic.[6] Klir and Yuan suggest applying powers and square roots to model such distinctions, since they don’t follow a linear scale. For example, they say that if we use a score of 0.8 to model the term “John is young,” squaring it would could model the phrase “very young” and using a square root could lead be used for “fairly young.” This is because the result of the first is 0.64, which strongly modifies the original term, while the second returns 0.89, which modifies it slightly.[7] Of course, the exact boundaries of all of these terms have to be set in light of domain knowledge of some kind. “Half” is a definite term but the modifier “about” can mean different things to different people, which may require aggregating the viewpoints of users in some way, perhaps using Decision Theory methods that integrate seamlessly with fuzzy sets. Neural nets likewise work well together with fuzzy sets because they are highly useful for encoding unknown functions, which means they can be put to use to derive such boundaries if greater precision is required. For many use cases, an informal guesstimate may suffice.
Translating Fuzzy Numbers into T-SQL
…………My sample code below implements four types of fuzzy numbers, using quite simple and arbitrary criteria that is merely designed to illustrate the concepts. For the sake of consistency, I’m once again using the procedure I wrote for Outlier Detection with SQL Server, part 2.1: Z-Scores to my derive membership grades and storing the results in a table variable (which has an extraneous column named GroupRank that can be safely ignored). In this case we’re calculating Z-Scores on the LactateDehydrogenase column of the Duchennes muscular dystrophy dataset I’ve been using as practice data for the last several tutorial series, which I downloaded ages ago from Vanderbilt University’s Department of Biostatistics and converted to a SQL Server table in a dummy DataMiningProjects database. Some of the key differences from previous articles include the absence of the ReversedZScore column and associated @Rescaling variables. This is because we don’t need to perform rescaling of any kind, since we’re measuring nearness to a few Z-Score values in all four examples, not calculating a relative score on a range of 0 to 1. The MembershipScore column is missing for the same reason. In its place, we have four computed columns, two of which measure the closeness of each Z-Score in the dataset to a target value or range.
…………To put it simply, the triangular number assigns a grade to the natural language statement, “around a Z-Score of 0.960526,” while the trapezoidal expresses the concept of “somewhere between 0.450526 and 1.360526.” The other two columns define increasing and decreasing functions that model how close the values are to either the top or bottom of the dataset, which can be interpreted as “few” or “most.” The hard-coded numbers in the UPDATE and the declarations above it are picked out of thin air merely to illustrate the point, not because they express any domain knowledge. There are probably more efficient ways of coding this, but the point is to get the concepts across.
Figure 1: Code for the Fuzzy Number Sample
DECLARE @ZScoreTable table
(PrimaryKey sql_variant,
Value decimal(38,6),
ZScore decimal(38,6),
TriangularNearnessScore decimal(38,6),
TrapezoidalNearnessScore decimal(38,6),
FewScore decimal(38,6),
MostScore decimal(38,6),
GroupRank bigint
)
INSERT INTO @ZScoreTable
(PrimaryKey, Value, ZScore, GroupRank)
EXEC Calculations.ZScoreSP
@DatabaseName = N’DataMiningProjects‘,
@SchemaName = N’Health‘,
@TableName = N’DuchennesTable‘,
@ColumnName = N’LactateDehydrogenase‘,
@PrimaryKeyName = N’ID’,
@DecimalPrecision = ’38,32′,
@OrderByCode = 8
DECLARE @ComparisonPoint float = 0.960526
DECLARE @LowerBound float = @ComparisonPoint – 0.5, — we could of course make it lopsided if that would model our data better
@UpperBound float = @ComparisonPoint + 0.5
UPDATE @ZScoreTable
SET TriangularNearnessScore = CASE WHEN ZScore NOT BETWEEN @LowerBound and @UpperBound THEN 0
WHEN ZScore = @ComparisonPoint THEN 1
WHEN ZScore < @ComparisonPoint THEN (ZScore – @ComparisonPoint) + 1
WHEN ZScore > @ComparisonPoint THEN (@ComparisonPoint – ZScore) + 1
ELSE NULL END,
TrapezoidalNearnessScore = CASE WHEN ZScore NOT BETWEEN @LowerBound and @UpperBound THEN 0
WHEN ZScore BETWEEN @LowerBound + 0.1 and @UpperBound – 0.1 THEN 1
WHEN ZScore < @LowerBound + 0.1 THEN (ZScore – @ComparisonPoint) + 1
WHEN ZScore > @UpperBound – 0.1 THEN (@ComparisonPoint – ZScore) + 1 ELSE NULL END,
FewScore = CASE WHEN ZScore BETWEEN 0.2 AND 0.7 THEN 1 ELSE 1 – (ZScore * 0.3) END,
MostScore = CASE WHEN ZScore BETWEEN 1 AND 2 THEN 1 ELSE ZScore / 1.2 END
SELECT PrimaryKey, ZScore, TriangularNearnessScore, TrapezoidalNearnessScore, FewScore, MostScore
FROM @ZScoreTable
WHERE ZScore BETWEEN 0.2 AND 2 AND TriangularNearnessScore != 0 AND TrapezoidalNearnessScore != 0
ORDER BY ZScore DESC
Figure 2: Sample Results from the Duchennes Practice Dataset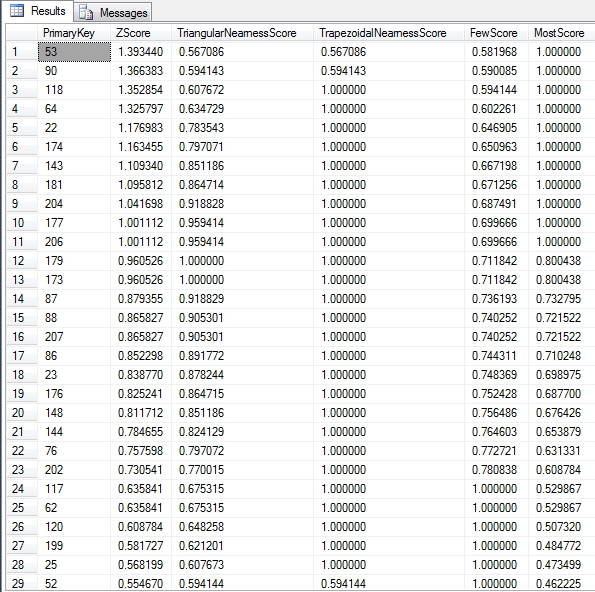
…………Note how the TriangularNearnessScore peaks at a single value, while the TrapezoidalNearnessScore is contained within a particular range. The FewScore and MostScore values peak at opposite ends of the dataset. Of course, a picture is worth a thousand words: if the values above aren’t clear, then the Reporting Services line graphs below ought to clear up any confusion. The TriangularNearnessScore doesn’t precisely follow a triangular shape, but it does come to single peak, which is good enough. The trapezoidal example reaches the same peak, but encompasses a range of values represented in the flat line. The FewScore and MostScore also have flat peaks, but these occur at the far edges of the membership grades. The shapes aren’t as neat as those in the literature, in part because I’m using real-world data from the Duchennes dataset together with some arbitrary range values, but I’m sure that readers will get the gist of it.
Figure 3: Reporting Services Line Graphs for 4 Fuzzy Number Samples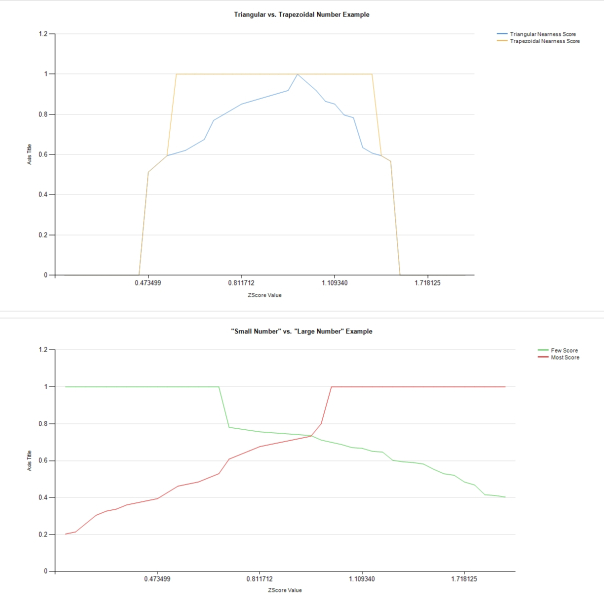
…………Asking questions like “what is about half of A plus almost all of B” is probably a rare use case, one that is more likely to come up in data mining than in relational situations. If the need for this kind of comparison does arise, be aware that at least some of the math has been worked out, so there’s no need to reinvent the entire wheel. I say “some” because, at least at the time Klir and Yuan wrote, mathematicians were still struggling with some of the strange properties and enigmatic logic associated with these kinds of comparisons.[8] Just imagine several of the trapezoids and triangles above overlaid and you can see how quickly the topics of fuzzy arithmetic, fuzzy set relations and fuzzy matrix math can become. Some basic procedures for solving them are available[9], as well as neural net techniques for solving fuzzy equations[10], but they lead to certain logical difficulties that I believe still aren’t fully understood, such as the fact that many of the approximate solutions may not be unique.[11] Thankfully, we don’t encounter statements like “between 3 and 5 of A minus a little of B” often in ordinary speech, so I imagine that SQL Server users are unlikely to encounter it. In contrast, qualifiers like “around” or “near” are so common that I guarantee these fuzzy numbers will prove valuable to many users in the long run.
…………Instead of taking fuzzy numbers in directions of this kind that lack real-world applications, I’ll instead use them as a stepping stone towards quantifying imprecision, which can be helpful in programs of uncertainty management. Many of the linguistic qualifiers mentioned here are actually instances of what is known as “fuzzy cardinality,” which enable modeling of phrases like “about a quarter” or “near.”[12] In the next article, I’ll delve into the realm of fuzzy statistics, where the implications of relative membership in a set leads automatically to a range of different types of cardinality, not just the single type of Count used in T-SQL. I have yet to see this done in the literature (I simply can’t afford access to most of the research published on certain advanced topics like fuzzy stats), but I’ll provide an example of how trapezoidal numbers might be implemented in order to create fuzzy analogues of standard deviation and variance. Given that the ordinary “crisp” versions of these aggregates are determined in part by counts, the fuzzification of counts plays into that as well. It may be useful to probe for connections to Fisher’s Information, a metric I hope to code for a long-delayed series titled Information Measurement with SQL Server, given that it apparently uses variance to model uncertainty. Using increasing and decreasing functions to model statements like “almost all” as we have done here can be seen as fuzzy instances of MIN and MAX aggregates, which essentially express the same sentiment as “near the bottom” or “near the top.” These can also be used to create new methods of fuzzy outlier detection, as I’ve essentially been doing throughout this series by using Z-Scores in my sample code; fuzzy set grades don’t have anything to do with stochastics or outlier detection unless such meanings are deliberately assigned.
…………In the next article I will probably continue to use Z-Scores in my sample code mainly for the sake of consistency and to reuse old, familiar concepts, but also to kill two birds with one stone and investigate possible uses in outlier detection. As we shall see, membership functions can also be interpreted in the light of Evidence Theory, in which each grade indicates the levels of credibility and truthfulness of a statement. In such cases, we’re speaking of fuzzy measures[13], which are also useful in partitioning and quantifying different types of uncertainty. As we already saw in Implementing Fuzzy Sets in SQL Server, Part 2: Measuring Imprecision with Fuzzy Complements, fuzzy complements can be used to measure one type of uncertainty, in quantifying just how imprecise the boundaries of fuzzy sets are; in essence, they become measures of fuzziness. There are other types of uncertainty, however, which require entirely different modeling techniques, which is where fuzzy stats and measures come in handy.
[1] Most fuzzy set references discuss triangulars and trapezoidals. One source I found to be helpful was pp. 12-13, Alavala, Chennakesava R., 2008, Fuzzy Logic and Neural Networks: Basic Concepts and Applications. New Age International Pvt. Ltd.: New Delhi.
[2] p. 3, Medeen, Glen, 2015, Two Examples of the Use of Fuzzy Set Theory in Statistics,” published online at the University of Minnesota web address http://users.stat.umn.edu/~gmeeden/talks/fuzznov09.pdf
[3] pp. 96-98, Klir, George J. and Yuan, Bo, 1995, Fuzzy Sets and Fuzzy Logic: Theory and Applications. Prentice Hall: Upper Saddle River, N.J.
[4] IBID., p. 228.
[5] IBID., p. 99.
[6] IBID., p. 222.
[7] IBID., p. 230.
[8] IBID., p. 115.
[9] IBID., pp. 160-162.
[10] IBID., pp. 171-173.
[11] IBID., pp. 153-157, 166-167.
[12] IBID., p. 98.
[13] IBID., p. 177.

![]()
