

As usual, the pager went off...
"Server is near 100% memory utilization - what is running?"
 |
| http://www.starshipearththebigpicture.com/wp-content/uploads/2015/09/red-alert-picard-300x228.jpg |
I saw when I signed on that the Windows server was at 98% memory utilization (the sum of all processes in Windows, including but not limited to SQL Server) and that the sqlservr.exe process for the single SQL Server 2008R2 instance was using a lion’s share of it – 77GB out of 80GB on the server.
The Max Server Memory cap in SQL Server was set to 72.5GB, so how was this possible?!?
A key that many DBAs don't consider is that there are multiple other processes that run outside of the Buffer Pool memory, and before SQL server 2012, the Buffer Pool was the only thing that is governed by the Max Server Memory cap. This is how the sqlservr process can use more than the cap.
When you configure Max Server Memory (you *have* configured Max Server Memory, right!!?!?!?!?!) all it was doing before SQL Server 2012 was setting a cap on the Buffer Pool. Not only does this not impact external SQL Server processes such as Reporting Service and Analysis Services, it doesn't even cover everything inside sqlservr.exe.
An interesting point in this situation was the fact that I saw that the Page Life Expectancy (PLE) was through the roof – over 88,000 on both NUMA nodes. Regardless of what guidelines you subscribe to, this is a very high number and indicates a large amount of free Buffer Pool.
This relates to how the SQL Server application (and most other enterprise applications) manage memory – they gradually grab more and more memory as they need it (for large queries, etc.) but they don’t release it gracefully (if at all).
 |
| http://i60.tinypic.com/1692rgj.jpg |
At some point some large query or other unit of work probably needed that 72GB of Buffer Pool memory, but it was mostly free at the time I checked the PLE value (as evidenced by the large number).
In many unfortunate cases the only way to release this memory from the Windows process is to restart the SQL Server service (MSSQLServer or MSSQL$instance) in Windows, or to lower the Max Server Memory cap in SQL Server (which will gradually force the Buffer Pool to release the memory it is holding to the level of the new cap - this can take many minutes depending on how much the value of Max Server Memory is decreased).
--
Sidebar: WARNING - as we have discussed in the past, remember that PLE is a trending number - the fact that PLE is 88,000 right now does *not* by itself indicate you have too much memory configured for your process - it just means that at the moment it was measured, there was significant free memory.
PLE needs to be monitored over time at different times of day during different times of the week and month. It may be that there is significant free memory right now, but at 2am when CheckDB is running (you *do* run CheckDB, right!!?!?!?!?!) or on the last day of the month when the payroll reports run, PLE may drop down to nothing as that process needs all of the memory available and then some.
NEVER, EVER, make capacity planning decisions solely on a single point-in-time value measurement - even if you think it is a busy time on the server! This is *NOT* an #ItDepends
 |
| http://static.comicvine.com/uploads/original/3/33200/3378703-9952743819-Prude.jpg |
--
As I was saying, there are many components that work outside of the buffer pool, and one of them (in 2008R2) is CLR (Common Language Runtime), the run-time process for executing .NET managed code (such as VB.NET and C#) inside SQL Server.
This was the output for the CLR memory space (from DBCC MEMORYSTATUS):
MEMORYCLERK_SQLCLR (node 0) KB
---------------------------------------- -----------
VM Reserved 6313088
VM Committed 25792
Locked Pages Allocated 0
SM Reserved 0
SM Committed 0
SinglePage Allocator 1408
MultiPage Allocator 39256
The DMV companion to this is sys.dm_os_memory_clerks, and a useful query is:
SELECT top 10 type,
virtual_memory_reserved_kb,
virtual_memory_committed_kb
from sys.dm_os_memory_clerks
order by virtual_memory_reserved_kb desc
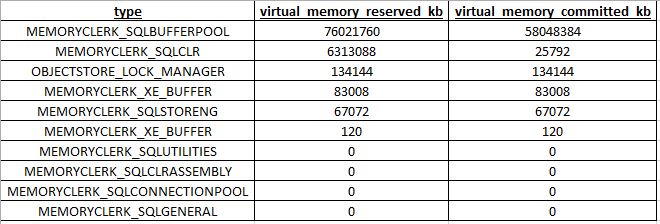
As you can see, the DMV returns comparable information. and you receive it in a nice tight query result set rather than an ugly 80-page DBCC output. 🙂
--
In the article referenced above, CLR is one of the things that shifts under Max Server Memory as of SQL Server 2012, so if this had been a SQL Server 2012/2014 the problem may not have even been noticed. With so much free Buffer Pool (high PLE) there might have been sufficient head room under Max Server Memory to handle the CLR needs *without* taking the server to 98%+ RAM utilization.
CLR is one of those things you just have to allow for when planning memory capacity and setting Max Server Memory on a SQL Server – in this case *unless* there was something unusual going on with the CLR – such as a new code release that has badly memory-managed code in it – this showed that the Max Server Memory cap needed to be set lower on this instance (or RAM needed to be added to the server) to allow for what CLR needed.
IMPORTANT - realize this need to plan for CLR is true regardless of your SQL version - on a SQL Server 2005/2008/2008R2, Max Server Memory needs to be set sufficiently low to give head room for CLR *outside* the cap, while on a newer SQL Server with the changes described above, the cap needs to be set high enough to include CLR's needs.
--
As the on-call I wasn't familiar with the regular workload of this server, so I advised the client and the primary DBA that if the current situation is the “real” and “normal” situation on this server, I recommended lowering Max Server Memory by 2GB-4GB to allow more head room for the operating system, etc. while still satisfying the needs of the CLR space.
I lowered the Max Server Memory cap is 70GB (71600MB) to try to help for the immediate time – since the PLE was so high it could handle it in the immediate term and the free memory on the Windows server went up to 5% (from 2% when I logged on).
At the end of the day I turned it over to the client's primary DBA to follow-up with the client as to whether this was a memory capacity problem - does the client really need 72.5GB of Buffer Pool *and* 6+GB of CLR memory? - or if it was a code/intermittent problem - was there a new piece of poorly written code that was the underlying cause of the issue?
--
The takeaway here is to remember that there are many things - CLR, extended events sessions, the lock manager, linked servers, and lots more - that function outside the realm of the Buffer Pool, depending on your SQL Server version. If your server uses CLR components, or if you do a lot of XEvents tracking, or use complicated extended stored procedures, etc., make sure to allow for that when capacity planning and when configuring Max Server Memory.
Hope this helps!
