

This post is a long overdue second part to the post on Chi Square Test that I did a few months ago. This post addresses relationships between two categorical variables, but in cases where data is sparse, and the numbers (in any cell) are less than 5. The Chi Square test is to be used when numbers are higher than 5, but what if you have a problem with smaller numbers, and you want to find the connection between variables involved, or if there is a connection involved? To study this i picked a simple example from our SQL Saturday data. I have a very simple matrix like below. This tells me count of speakers, by gender, and separated as new (new to our event, not new entirely), and repeat, those who have attended our event.
| Speakers | New | Repeat | Row Total |
| Male | 2 | 11 | 13 |
| Female | 1 | 2 | 3 |
| Column Total | 3 | 13 | 16 |
Step 1 – Setup Hypothesis: What is the question am trying to answer? – if I were to choose 3 new speakers at random, say – what is the probability that a minimum of 1 of them will be a woman? Another more simplified way of stating the same problem is – Is there a correlation between gender and number of new speakers? From a statistical perspective, the assumption is a ‘no’ to begin with. (also called Null Hypothesis). If we disprove this statement, we prove the opposite – that there is a relationship. If not, there isn’t. So putting it down:
H0, or Null hypothesis : There is no correlation between gender and new speaker count that is statistically significant.
H1: The alternate hypothesis: There is a correlation between gender and new speaker count that is statistically significant.
What do both of these statements mean mathematically, or in other words , what would be the basis on which we make this decision? We can look at that in Step 3.
Step 2: Set up the appropriate test statistic: We choose to use Fischer’s test because of the sparse number of values we have, and also because our variables of choice are categorical.
Step 3: How do i decide? : The decision rule in two sample tests of hypothesis depends on three factors :
1 Whether the test is upper, lower or two tailed (meaning the comparison is greater, lesser or both sides of gender and speaker count)
2 The level of significance or degree of accuracy needed,
3 The form of test statistic.
Our test here is to just find out if gender and speaker count are related so it is a two tailed test. The level of significance we can use is the most commonly used 95% which is also the default in R for Fischer’s Test. The form of the test statistic is P value. So our decision rule would be that gender and speaker category are related if P value is less than 0.05.
Step 4: Calculation
Now, time to do the math...first, with R:
Input =(" Speaker New Repeat
 Male 2 11
 Female 1 2
 ")

 TestData = as.matrix(read.table(textConnection(Input),
 header=TRUE, row.names=1))
fisher.test(TestData,alternative="two.sided")
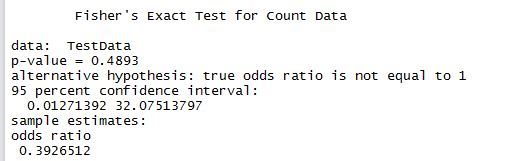
R is telling us that the p value is 0.4893. way above 0.05. And hence per our decision rule the two elements are not correlated based on the sparse data we have.
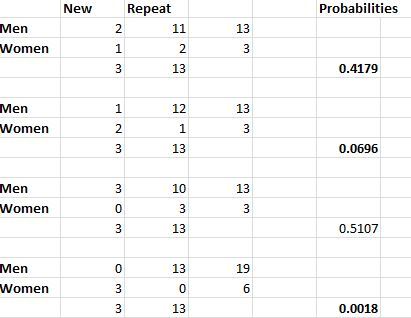
Now let us try the same thing with T-SQL. The calculation for Fischer’s test is rather elaborate when done manually – which is where you can appreciate how elegant and easy it is to use built-in functions with R. To do it otherwise, you need to not only code the calculation, but also come up with different possibilities of the same matrix. That is those that total up the same row and column wise. Then calculate the probabilities on each of them and sum those probabilities that are less than the ‘base probability’, or the one we derive from the base matrix. In this case we have 4 possible matrices as below, and each of the their probabilities (calculated with T-SQL) and as shown
T-SQL to calculate probabilities: All probability related math needs calculation of factorials. For this purpose I used the method described by Jeff Moden here.
DECLARE @newmen int , @newwomen int
, @repeatmen int , @repeatwomen int

DECLARE @pvalue numeric(18, 4)
DECLARE @numerator1 float,@numerator2 float,@numerator3 float,@numerator4 float,@numerator5 float
DECLARE @denominator1 float,@denominator2 float,@denominator3 float,@denominator4 float,@denominator5 float

SELECT @newmen = 2, @newwomen = 1, @repeatmen = 11, @repeatwomen = 2


SELECT @numerator1 = [n!] FROM [dbo].[Factorial] WHERE N = (@newmen+@newwomen)
--select @newmen+@newwomen
SELECT @numerator2 = [n!] FROM [dbo].[Factorial] WHERE N = (@repeatmen+@repeatwomen)
--select @repeatmen+@repeatwomen

SELECT @numerator3 = [n!] FROM [dbo].[Factorial] WHERE N = (@newmen+@repeatmen)
--select @newmen+@repeatwomen

SELECT @numerator4 = [n!] FROM [dbo].[Factorial] WHERE N = (@newwomen+@repeatwomen)
--select @newwomen+@repeatmen

--select @numerator1, @numerator2, @numerator3, @numerator4
SELECT @denominator1 = [n!] FROM [dbo].[Factorial] WHERE N = @newmen
SELECT @denominator2 = [n!] FROM [dbo].[Factorial] WHERE N = @newwomen
SELECT @denominator3 = [n!] FROM [dbo].[Factorial] WHERE N = @repeatmen
SELECT @denominator4 = [n!] FROM [dbo].[Factorial] WHERE N = @repeatwomen
SELECT @denominator5 = [n!] FROM [dbo].[Factorial] WHERE N = (@newmen+@newwomen+@repeatmen+@repeatwomen)
SELECT @pvalue = (@numerator1*@numerator2*@numerator3*@numerator4)/(@denominator1*@denominator2*@denominator3*@denominator4*@denominator5)
--select @denominator1, @denominator2, @denominator3, @denominator4, @denominator5
SELECT 'Matrix 1 - Pcutoff' as Matrix, @pvalue as PValue


SELECT @newmen = 1, @newwomen = 2, @repeatmen = 12, @repeatwomen = 1

SELECT @numerator1 = [n!] FROM [dbo].[Factorial] WHERE N = (@newmen+@newwomen)
--select @newmen+@newwomen
SELECT @numerator2 = [n!] FROM [dbo].[Factorial] WHERE N = (@repeatmen+@repeatwomen)
--select @repeatmen+@repeatwomen

SELECT @numerator3 = [n!] FROM [dbo].[Factorial] WHERE N = (@newmen+@repeatmen)
--select @newmen+@repeatwomen

SELECT @numerator4 = [n!] FROM [dbo].[Factorial] WHERE N = (@newwomen+@repeatwomen)
--select @newwomen+@repeatmen

--select @numerator1, @numerator2, @numerator3, @numerator4
SELECT @denominator1 = [n!] FROM [dbo].[Factorial] WHERE N = @newmen
SELECT @denominator2 = [n!] FROM [dbo].[Factorial] WHERE N = @newwomen
SELECT @denominator3 = [n!] FROM [dbo].[Factorial] WHERE N = @repeatmen
SELECT @denominator4 = [n!] FROM [dbo].[Factorial] WHERE N = @repeatwomen
SELECT @denominator5 = [n!] FROM [dbo].[Factorial] WHERE N = (@newmen+@newwomen+@repeatmen+@repeatwomen)
SELECT @pvalue = (@numerator1*@numerator2*@numerator3*@numerator4)/(@denominator1*@denominator2*@denominator3*@denominator4*@denominator5)
--select @denominator1, @denominator2, @denominator3, @denominator4, @denominator5
SELECT 'Matrix 2' as Matrix, @pvalue as PValue


SELECT @newmen = 3, @newwomen = 0, @repeatmen = 10, @repeatwomen = 3


SELECT @numerator1 = [n!] FROM [dbo].[Factorial] WHERE N = (@newmen+@newwomen)
--select @newmen+@newwomen
SELECT @numerator2 = [n!] FROM [dbo].[Factorial] WHERE N = (@repeatmen+@repeatwomen)
--select @repeatmen+@repeatwomen

SELECT @numerator3 = [n!] FROM [dbo].[Factorial] WHERE N = (@newmen+@repeatmen)
--select @newmen+@repeatwomen

SELECT @numerator4 = [n!] FROM [dbo].[Factorial] WHERE N = (@newwomen+@repeatwomen)
--select @newwomen+@repeatmen

--select @numerator1, @numerator2, @numerator3, @numerator4
SELECT @denominator1 = [n!] FROM [dbo].[Factorial] WHERE N = @newmen
SELECT @denominator2 = [n!] FROM [dbo].[Factorial] WHERE N = @newwomen
SELECT @denominator3 = [n!] FROM [dbo].[Factorial] WHERE N = @repeatmen
SELECT @denominator4 = [n!] FROM [dbo].[Factorial] WHERE N = @repeatwomen
SELECT @denominator5 = [n!] FROM [dbo].[Factorial] WHERE N = (@newmen+@newwomen+@repeatmen+@repeatwomen)
SELECT @pvalue = (@numerator1*@numerator2*@numerator3*@numerator4)/(@denominator1*@denominator2*@denominator3*@denominator4*@denominator5)
--select @denominator1, @denominator2, @denominator3, @denominator4, @denominator5
SELECT 'Matrix 3' as Matrix, @pvalue as PValue

SELECT @newmen = 0, @newwomen = 3, @repeatmen = 13, @repeatwomen = 0


SELECT @numerator1 = [n!] FROM [dbo].[Factorial] WHERE N = (@newmen+@newwomen)
--select @newmen+@newwomen
SELECT @numerator2 = [n!] FROM [dbo].[Factorial] WHERE N = (@repeatmen+@repeatwomen)
--select @repeatmen+@repeatwomen

SELECT @numerator3 = [n!] FROM [dbo].[Factorial] WHERE N = (@newmen+@repeatmen)
--select @newmen+@repeatwomen

SELECT @numerator4 = [n!] FROM [dbo].[Factorial] WHERE N = (@newwomen+@repeatwomen)
--select @newwomen+@repeatmen

--select @numerator1, @numerator2, @numerator3, @numerator4
SELECT @denominator1 = [n!] FROM [dbo].[Factorial] WHERE N = @newmen
SELECT @denominator2 = [n!] FROM [dbo].[Factorial] WHERE N = @newwomen
SELECT @denominator3 = [n!] FROM [dbo].[Factorial] WHERE N = @repeatmen
SELECT @denominator4 = [n!] FROM [dbo].[Factorial] WHERE N = @repeatwomen
SELECT @denominator5 = [n!] FROM [dbo].[Factorial] WHERE N = (@newmen+@newwomen+@repeatmen+@repeatwomen)
SELECT @pvalue = (@numerator1*@numerator2*@numerator3*@numerator4)/(@denominator1*@denominator2*@denominator3*@denominator4*@denominator5)
--select @denominator1, @denominator2, @denominator3, @denominator4, @denominator5
SELECT 'Matrix 4' as Matrix, @pvalue as PValue
The response we get is as below.
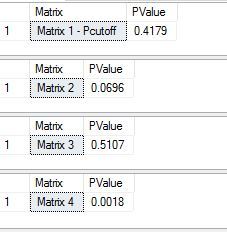
If we sum the 3 values that are less than base value 0.4179 – we get 0.4179 + 0.0696 + 0.0018 = 0.4893, which is exactly what we got from the R function.
Step 5: Conclusion: Since 0.4893 is greater than our desired value of 0.05, our decision rule did not pass. Or in other words, we accept the null hypothesis in Step 1, that there is no significant correlation between these two variables.
So, we can logically conclude, that based on the data we are given, we do not have enough evidence that gender of speakers and their count is actually related or significant. Thanks for reading!!

![]()
