

When I’m using Profiler to analyse performance issues I often save the results to a table, or upload a trace file into a table, so that I can analyse the data. Often this involves aggregating the values for particular queries so that I can see the most resource hungry.
This is by no means a difficult process, but with Extended Events (XE) it’s arguably even easier.
Let’s start with a session from XEvent Profiler like we saw in my last post on this subject:
Extended Events Made Easy: Using XEvent Profiler
I’ve set a workload running and captured the Live Data. The workload consists of some arbitrary queries I’ve written, each running in a loop in its own query window.
After a few minutes I stop the session so I can do my analysis:
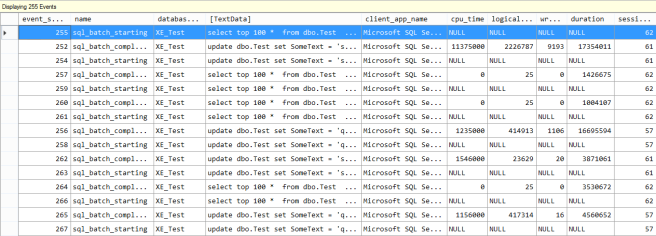
I’ve got a couple of hundred events. Let’s say I want to quickly find the longest running individual query. In the Live Data viewer you can just right-click on the column name and select sort ascending or descending. This is pretty obvious stuff, but I thought it was worth highlighting as you can’t do the same in Profiler – there you have to save to a table first then query the table.
So, I’ve sorted descending on Duration:
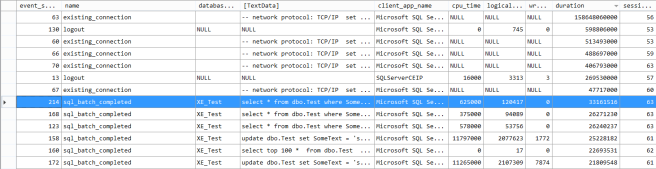
You can see the biggest values shown are the aggregated values for the existing_connection and logout events. In retrospect it might have been better to create an XE session that didn’t include these events. However, I look down the list and quickly find my longest running query (highlighted in blue).
The duration specified – 33,161,516 – is in microseconds. So that is just over 30 seconds.
Of course, now I’m thinking – that’s my longest running, but what I really want is the one that has the most CPU – and not just from one execution but the total from all the executions that happened in my sample time frame.
This is where I can use grouping and aggregation. I can right-click on any of the columns and select “Group by this column”. I’m going to do that for the TextData column:
We’re now seeing all the events from the sample time period, grouped together based on TextData. The number on the right of each one is the count of events in that group.
Now I can add some aggregations. After grouping I still can see the original column headings at the top, so I just right-click on cpu_time, select “Calculate Aggregation” and select “SUM”:
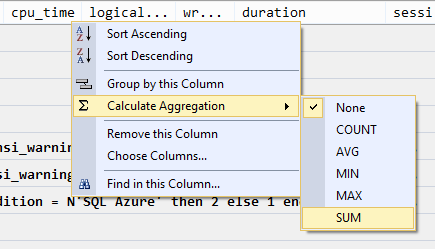
You’ll see you can pick the other standard aggregations also e.g. MIN, MAX, AVG etc.
You can have multiple aggregations going on, so I’ll do the same for duration and logical_reads.
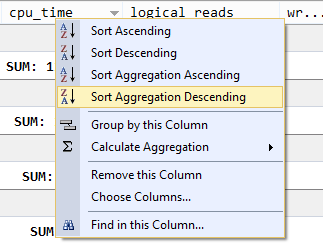
Once I have my aggregations in place, I’ll want to sort the results. It’s the total cpu_time I’m most interested in so I right-click on that column and now I have the option to “Sort Aggregation Descending”:
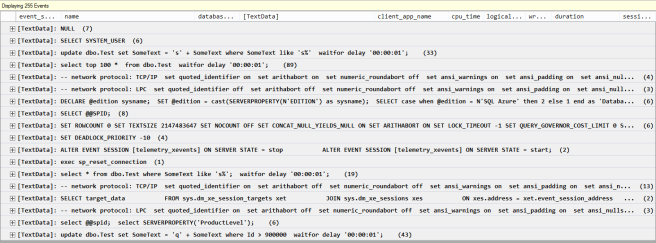
After those steps this is what I end up with (I’ll just show the top few rows):
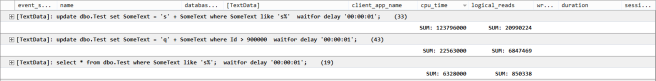
Admittedly this isn’t the most beautiful of views, but it was quick and easy to get to and it gives me the information I need. I can see my most CPU hungry queries and I can make a plan of action.
Incidentally, the top query was:
UPDATE dbo.Test SET SomeText = 's' + SomeText WHERE SomeText LIKE 's%'
If this wasn’t a totally arbitrary set of queries for demo purpose I might be considering putting an index on the SomeText column.
That’s all I wanted to cover in this post. Hopefully you can see that XE data is really easy to work with, you don’t have to get involved in XML querying and you can perform quick analysis without even having to write SQL – much as we all love writing SQL.
In the last couple of posts, I’ve looked at how easy it is to get started using XE with the XEvent Profiler. For the next post in this series I aim to demonstrate that it’s also really easy to create your own customizable Extended Events sessions.
Previous posts in this series:
There’s Still a Place for SQL Server Profiler
Using the built-in System Health session
