

Today’s blog will be the second in a multi-part series on replicating Excel functions in T-SQL, continuing with Excel’s NORM.DIST built-in function, thus enshrining my geekdom in the SQLverse forever.
Today’s solutions will once again focus on creating T-SQL in-line, Table Valued Functions (iTVFs), introduced in SQL Server 2005, that apply my solution techniques to the general case of calculating the value of the Normal Distribution’s Probability Density Function (PDF) and Cumulative Distribution Function (CDF), for any mean and standard deviation you specify. I will not be doing any performance testing of today’s iTVFs; however I have done my best to utilize T-SQL performance best practices in their construction. I will also provide you some links to alternate solutions I have seen. Since all are approximation algorithms (including mine), the difference to our readers is probably going to be in which produces the lowest error results. Only you can be the best judge of which that is.
The Normal Distribution
As I’ve said before I’m no statistician, but I have seen the Normal Distribution and most likely you’ve seen it too. The normal distribution has many interesting properties, starting with the:
- Mean – The average of all sample points representing the population, which appears as the center line of a normal distribution (probability density) function’s curve.
- Standard Deviation – A measure of the elongation of the tails of the distribution.
Graphically I’m sure you’ve seen the normal distribution before, with the blue line (below) being what you normally (no pun intended) see. This is the normal distribution’s probability density function (PDF). The red line is also of interest, and this is called the cumulative distribution function (CDF).

Notice how the blue line (PDF) is bilaterally symmetrical about the mean value, which in the above case is ten. This simply means that there’s an equal portion of the curve on both the left and the right of the mean. Another property of the PDF for any distribution is that the area under the curve is exactly equal to one, and this applies regardless of what the mean and standard deviation are. In fact, it also applies to other statistical distributions, so long as it is the PDF you’re talking about.
The CDF represents the area under the PDF at any particular point along the PDF line. For example, if we draw two intersecting lines as in the example below, with the first (vertical) line through the mean and the second line intersecting the first and also the CDF, we see:
- The clear bilateral symmetry of the PDF line, where half of the area appears to the left of the bisecting line and the other half appears to the right.
- The horizontal line intersecting the right vertical access at 0.5, indicating that the value of the CDF (the area under the PDF) at the mean is precisely 0.5, meaning that the total area of the PDF curve is 1.0, which is also the point at which the red curve intersects with the right axis.
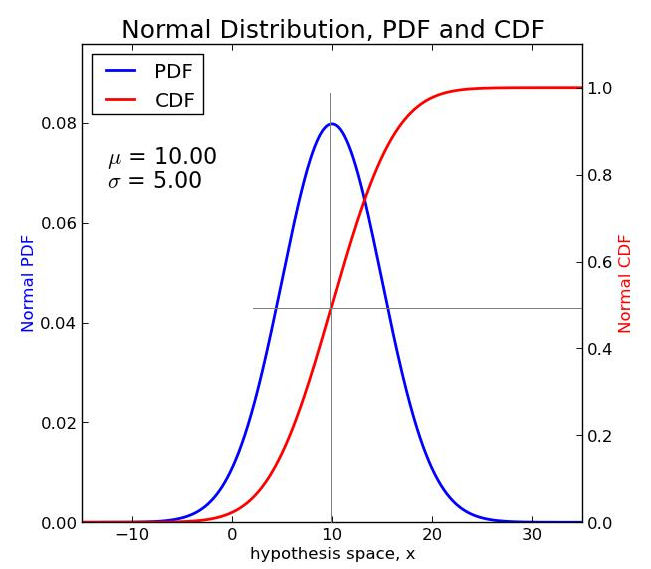
This same relationship holds for the PDF/CDF of any other distribution.
Computing the Normal Distribution’s Probability Density Function
If you go to the Wiki page for the Normal Distribution linked above (or many other sources), you will see that the PDF for the normal distribution can be represented mathematically as:

Where µ = the arithmetic mean and s2= the standard deviation. The variance (s) is the square root of the standard deviation.
Also, SQL has the PI and EXP built-in functions to support this equation.
SELECT PI(), EXP(1.);
-- Results:
3.14159265358979    2.71828182845905
In SQL terms, this is relatively straightforward to compute, and we’ll show that in a minute.
Let’s look now at the Excel NORM.DIST function, which takes four arguments:
- x is the point where we wish to calculate the value of the normal distribution, which could be any point along the x-axis of the graphics above.
- µ is the mean for the normal distribution of interest.
- s2 is the standard deviation for the normal distribution of interest.
- The last (fourth) argument to NORM.DIST is a logical (TRUE/FALSE) value which specifies whether you want to calculate the value for the PDF (if FALSE) or the CDF (if TRUE).
There is also a special case of the normal distribution, known as the Standard Normal Distribution, where the mean is zero and the standard deviation is one. For this special case, the PDF function is somewhat simpler and can be written as:

As I am also no mathematician, I am thankful that all of the formulas so far have simply been copied out of the relevant sources.
Since I am a T-SQL guy, I must now focus on my specialty and present a function that will calculate the probability density function (PDF) for both the standard and general normal distributions.
CREATE FUNCTION dbo.NORMAL_PDF
-- Normal Distribution - Returns two bits of information:
--  NPDF(X) - The Normal Probability Density Function's value at given mean and std deviation
--  SNPDF(X) - The Standard Normal Probability Density Function's value (mean=0, std dev=1)
(
    @X          FLOAT       -- Point at which function is to be evaluated
    ,@Mean      FLOAT       -- Mean of the Normal Distribution
    ,@StdDev    FLOAT       -- Standard Deviation of the Normal Distribution
)
RETURNS TABLE WITH SCHEMABINDING
RETURN
SELECT X        = @X
    ,Mean       = @Mean
    ,StdDev     = @StdDev
    -- Normal Probability Density Function for Mean and Standard Deviation
    ,[NPDF(X)]  = EXP(-0.5*(@X-@Mean)*(@X-@Mean) /
                    (@StdDev*@StdDev))/(SQRT(2.*PI())*@StdDev)
    -- Standard Normal Probability Density function for Mean=0 and StdDev=1
    ,[SNPDF(X)] = EXP(-0.5*@X*@X)/SQRT(2.*PI());
Let’s now construct an Excel spreadsheet to calculate the PDF for the normal distribution using a couple of different mean/standard deviation combinations, so we can check the results from our function.

The highlighted cell’s formula is in the formula text box above, showing you how to calculate the PDF for the normal distribution where mean is two and standard deviation is 0.5 (from columns B and C).
We’ve left a couple of columns open so we can run the following T-SQL script that uses our iTVF to calculate the PDF values at the various Xs. The differences columns are currently showing the same value as appears in the Excel column with reversal of sign.
WITH SampleData (X, Mean, StdDev) AS
(
    SELECT -1,2,0.5
    UNION ALL SELECT -0.5,2,0.5
    UNION ALL SELECT 0,2,0.5
    UNION ALL SELECT 0.5,2,0.5
    UNION ALL SELECT 1,2,0.5
    UNION ALL SELECT 1.5,2,0.5
    UNION ALL SELECT 2,2,0.5
    UNION ALL SELECT 2.5,2,0.5
    UNION ALL SELECT 3,2,0.5
    UNION ALL SELECT 3.5,2,0.5
    UNION ALL SELECT 4,2,0.5
    UNION ALL SELECT 2.33,10,5
    UNION ALL SELECT 4.22,10,5
    UNION ALL SELECT 5.1,10,5
    UNION ALL SELECT 8.2,10,5
    UNION ALL SELECT 10,10,5
    UNION ALL SELECT 11.5,10,5
    UNION ALL SELECT 12.6,10,5
    UNION ALL SELECT 16.8,10,5
    UNION ALL SELECT 22.5,10,5
)
SELECT a.X, a.Mean, a.StdDev, b.[NPDF(X)], b.[SNPDF(X)]
FROM SampleData a
CROSS APPLY dbo.NORMAL_PDF(X, Mean, StdDev) b;
When we run the above script, then copy/paste the output from the SSMS Results pane into our spreadsheet, it now looks like this.

The cell formula at the top now shows you how to calculate the PDF for the standard normal distribution in Excel (second and third arguments are different from the prior Excel graphic).
The red bordered columns now show very miniscule differences between the values computed by T-SQL for the normal distributions’ PDF and SNPDF. These calculations are probably accurate enough to say that we’ve replicated the Excel NORM.DIST function’s results when its fourth argument is FALSE.
Computing the Normal Distribution’s Cumulative Distribution Function (CDF)
We can easily add a few columns to our spreadsheet to show you how easy it is in Excel to calculate the CDF for our two distributions, including some placeholders for when we get to the point of having some results in T-SQL.

Note that the highlighted cell’s formula is shown in Excel’s formula entry text box.
While the PDF for the normal distribution can be represented in what is known as “closed form” (see the formulas above), the CDF cannot be represented in closed form. Instead we need to represent the value of the CDF at a point (X) as a definite integral, which is essentially just calculating the area under the PDF.

At the sight of the integral symbol, I’m sure that some of my reader’s eyes have glazed over. Once again though, this is a formula not of my own making, but one which can be found in many sources. My hope is that I don’t lose you here, because if you read on you just might find some really interesting stuff!
Let us consider a simple case, for example where X = µ (the mean). In that case, from our graphical look at the two PDF/CDF curves, it implies that the value of the CDF should be 0.5. If we look at cells J9 and J18 in the last Excel spreadsheet shown, we see that indeed Excel’s NORM.DIST function computes exactly that value for the CDF.
To replicate this in T-SQL, we’ve got just a bit of a problem though. Unfortunately, T-SQL does not have an “INTEGRATE” built-in function!
The Fundamental Theorem of Calculus
I know that’s a mouthful, but the fundamental theorem of calculus is going to give us a way to construct a set-based algorithm that will allow us to calculate the CDF of the normal distribution. If you haven’t taken calculus, or can’t be bothered to try to remember what the fundamental theorem says, you might want to skip ahead to the next section and just get to the T-SQL. But as I’ve said many times, since I am no mathematician, I’ll need to keep my explanation as simple as possible in the hopes that I don’t trip myself up and that my readers can follow along.
Let’s look at a graphical example.

Suppose we were interested in the CDF where X=5. We could construct a series of rectangles that extend from the lowest value of the left tail of the distribution, up to where X=5. As these rectangles get smaller and smaller, the sum of the areas within the rectangles approaches quite closely the value of the CDF. Technically, this is expressed as a “limit” where the width of the rectangle à 0.
That is essentially the fundamental theorem of calculus, or the part that interests us anyway.
Unfortunately, we’re not quite done with our exotica yet. Constructing a set-based formula that sets up a specific (known) number of rectangles from -8 (negative infinity) up to our value of X, is problematic at best. So we’re going to fall back on something that I pointed out earlier. This is that the area under the curve where x=10 (the mean in this example) is 0.5. So instead we can solve the following integral when X is less than our mean.

And alternatively, when x is greater than the mean:

Gosh! That still doesn’t sound too simple, but in reality we are now quite close to integrating the normal distribution’s PDF at a point of interest, and doing it with a set-based algorithm.
By now my regular readers are probably used to my little T-SQL sleight of hand tricks. So here’s another. Consider the following script.
DECLARE
    @X          FLOAT = 1.5     -- Point at which function is to be evaluated
    ,@Mean      FLOAT = 2.      -- Mean of the Normal Distribution
    ,@StdDev    FLOAT = 0.5     -- Standard Deviation of the Normal Distribution
;

WITH CalculateIntervals AS
(
    -- Total intervals (about 5 per standard deviation)
    SELECT Intervals = 5 * ABS(@Mean - @X) / @StdDev
        -- Number of intervals per standard deviation
        ,Interval    = 5
),
    Tally (n) AS
(
    -- Up to 10,000 row tally table
    SELECT TOP (SELECT CAST(Intervals AS INT) FROM CalculateIntervals)
        ROW_NUMBER() OVER (ORDER BY (SELECT NULL))
    FROM (VALUES(0),(0),(0),(0),(0),(0),(0),(0),(0),(0)) a(n)
    CROSS JOIN (VALUES(0),(0),(0),(0),(0),(0),(0),(0),(0),(0)) b(n)
    CROSS JOIN (VALUES(0),(0),(0),(0),(0),(0),(0),(0),(0),(0)) c(n)
    CROSS JOIN (VALUES(0),(0),(0),(0),(0),(0),(0),(0),(0),(0)) d(n)
)
SELECT X = @X
    ,Mean = @Mean
    ,StdDev = @StdDev
    ,Intervals
    ,n
    ,Pos1
    ,Pos2
    ,Width
    ,Height = AvgX
    --    Width x Height = NPDF(AvgX)
    ,Area=Width * e.[NPDF(X)]
FROM CalculateIntervals a
CROSS JOIN Tally b
CROSS APPLY
(
    SELECT Pos1     = @Mean + (@StdDev/Interval) * (n - 1.) * SIGN(@X - @Mean)
        ,Pos2       = @Mean + (@StdDev/Interval) * (n + 0.) * SIGN(@X - @Mean)
        ,Width      = ABS(@Mean - @X)/Intervals
) c
CROSS APPLY
(
    -- Cheat the rectangle's height - make it the average of Pos1 and Pos2
    SELECT AvgX = 0.5 * (Pos1 + Pos2)
) d
CROSS APPLY dbo.NORMAL_PDF(AvgX, @Mean, @StdDev) e;
Let’s take this bit of magic and decompose it one step at a time.
- We start by declaring three local variables, which will ultimately become arguments to the iTVF we hope to create.
- The CalculateIntervals CTE creates two intermediate column values that we’ll use later: 1) the first is the total number of intervals, and 2) is the intervals per standard deviation that our X of interest is from our mean.
- The Tally CTE is just an in-line Tally table that is limited to the number of rows set up in the Intervals (total intervals) column of the CalculateIntervals CTE. The intervals themselves are simply used to represent the rectangles we described above.
- Next (in our FROM clause in the main query) we take the one row that is returned from the CalculateIntervalsCTE and CROSS JOIN it with the Tally table’s results, so that we’ve consolidated everything we need onto each row.
- The first of three cascading CROSS APPLYs calculates two positions (Pos1 and Pos2) and the width of our rectangle. These calculations will be clearer when we look at the results set (below).
- The second cascading CROSS APPLY “cheats” the height of the rectangle, to be the average of Pos1 and Pos2. This introduces some level of error into our calculations, and there are ways around that (too advanced for me and this blog). One way to reduce this error is to introduce more intervals (or rectangles).
- Lastly, in our final CROSS APPLY we call our NORMAL_PDF function to calculate the value of the PDF at AvgX where the mean and standard deviation are specified.
Note that this code fails miserably (no results rows produced) when @X = @Mean, but we’ll handle that in our iTVF. Here are the results:
X    Mean  StdDev  Intervals  n  Pos1   Pos2  Width   Height  Area
1.5  2     0.5     5          1  2      1.9   0.1     1.95    0.0793905094954024
1.5  2     0.5     5          2  1.9    1.8   0.1     1.85    0.0762775630921048
1.5  2     0.5     5          3  1.8    1.7   0.1     1.75    0.0704130653528599
1.5  2     0.5     5          4  1.7    1.6   0.1     1.65    0.0624507866733522
1.5  2     0.5     5          5  1.6    1.5   0.1     1.55    0.053217049979751
The X, Mean, StdDev and n columns should require no explanation. The Intervals column will be five times the number of standard deviations that X is from our mean (note that X could be less than or greater than the mean). Pos1 and Pos2 compute the right and left points of our interval (which may be reversed if @X > @Mean), while width is computed based on the total difference between X and our mean divided by the total number of intervals. See the comment in the code about “cheat the height?” Height in the result set is simply the average of Pos1 and Pos2. Finally, the Area is Width * Height, which when summed across all five of our rectangles and adjusted according to the value of the CDF at the midpoint (0.5) should be a reasonably close approximation of the CDF of the normal distribution at X! This approximation should improve if we use more than five rectangles per standard deviation.
To put all of this another way, we’ve implemented the fundamental theorem of calculus by using a tally table to calculate our little rectangles, in order to integrate under a curve. Too bad I didn’t think of that example when I wrote my Tally tables blog!
A T-SQL iTVF to Calculate the Normal Distribution’s Cumulative Distribution Function (CDF)
At this time, it is just a little more work to get to where we want to be. This is an iTVF to simulate the NORM.DIST function in Excel. We’ll need to eliminate some of the unnecessary intermediate results from the previous script, and also combine a couple of extra bits to calculate the PDF and the CDF when X is at the mean, but you can read the comments in the function to see those additions.
We’re also going to make our function allow for a little additional selectivity by adding one argument that can adjust the number of intervals per standard deviation.
CREATE FUNCTION dbo.Excel_NORM_DIST
-- Excel Normal Distribution - Returns either:
--  Probability Density Function (PDF) or
--  Cumulative Distribution Function (CDF)
(
    @X          FLOAT   -- Point at which function is to be evaluated
    ,@Mean      FLOAT   -- Mean of the Normal Distribution
    ,@StdDev    FLOAT   -- Standard Deviation of the Normal Distribution
    ,@CumDist   TINYINT -- =0 for Probability Density, =1 for Cumulative Density
    ,@Intervals INT = NULL
)
RETURNS TABLE WITH SCHEMABINDING
RETURN
WITH CalculateIntervals AS
(
    -- Total intervals (default is about 100 per standard deviation)
    SELECT Intervals = ISNULL(@Intervals, 100) * ABS(@Mean - @X) / @StdDev
        -- Number of intervals per standard deviation
        ,Interval    = ISNULL(@Intervals, 100)
),
    Tally (n) AS
(
    -- Up to 10,000 row tally table
    SELECT TOP (SELECT CAST(Intervals AS INT) FROM CalculateIntervals)
        ROW_NUMBER() OVER (ORDER BY (SELECT NULL))
    FROM (VALUES(0),(0),(0),(0),(0),(0),(0),(0),(0),(0)) a(n)
    CROSS JOIN (VALUES(0),(0),(0),(0),(0),(0),(0),(0),(0),(0)) b(n)
    CROSS JOIN (VALUES(0),(0),(0),(0),(0),(0),(0),(0),(0),(0)) c(n)
    CROSS JOIN (VALUES(0),(0),(0),(0),(0),(0),(0),(0),(0),(0)) d(n)
)
-- PDF
SELECT X, Mean, StdDev, [F(X)]=[NPDF(X)]
FROM
(
    SELECT X        = @X
        ,Mean       = @Mean
        ,StdDev     = @StdDev
        ,[NPDF(X)]
    FROM dbo.NORMAL_PDF(@X, @Mean, @StdDev)
) a
WHERE @CumDist = 0
UNION ALL
-- CDF where X = mean
SELECT X        = @X
    ,Mean       = @Mean
    ,StdDev     = @StdDev
    ,[CDF(X)]   = 0.5
WHERE @CumDist = 1 AND @X = @Mean
UNION ALL
-- CDF where X  mean
SELECT X, Mean, StdDev, [CDF(X)]
FROM
(
    SELECT X        = @X
        ,Mean       = @Mean
        ,StdDev     = @StdDev
        --                  SUM the rectangles
        ,[CDF(X)]   = 0.5 + SUM(
                                -- Add to or remove from CDF at mean (0.5)
                                SIGN(@X - @Mean) *
                                -- Width x Height = NPDF(AvgX)
                                Width * d.[NPDF(X)]
                                )
    FROM CalculateIntervals a
    CROSS JOIN Tally b
    CROSS APPLY
    (
        SELECT Pos1     = @Mean + (@StdDev/Interval) * (n - 1.) * SIGN(@X - @Mean)
            ,Pos2       = @Mean + (@StdDev/Interval) * (n + 0.) * SIGN(@X - @Mean)
            ,Width      = ABS(@Mean - @X)/Intervals
    ) c
    --                         -- Average height --
    CROSS APPLY dbo.NORMAL_PDF(0.5 * (Pos1 + Pos2), @Mean, @StdDev) d
) a
WHERE @CumDist = 1 AND @X  @Mean;
GO

WITH SampleData (X, Mean, StdDev) AS
(
    SELECT -1,2,0.5
    UNION ALL SELECT -0.5,2,0.5
    UNION ALL SELECT 0,2,0.5
    UNION ALL SELECT 0.5,2,0.5
    UNION ALL SELECT 1,2,0.5
    UNION ALL SELECT 1.5,2,0.5
    UNION ALL SELECT 2,2,0.5
    UNION ALL SELECT 2.5,2,0.5
    UNION ALL SELECT 3,2,0.5
    UNION ALL SELECT 3.5,2,0.5
    UNION ALL SELECT 4,2,0.5
    UNION ALL SELECT 2.33,10,5
    UNION ALL SELECT 4.22,10,5
    UNION ALL SELECT 5.1,10,5
    UNION ALL SELECT 8.2,10,5
    UNION ALL SELECT 10,10,5
    UNION ALL SELECT 11.5,10,5
    UNION ALL SELECT 12.6,10,5
    UNION ALL SELECT 16.8,10,5
    UNION ALL SELECT 22.5,10,5
)
SELECT a.X, a.Mean, a.StdDev
    ,[NPDF(X)]  = c.[F(X)]
    ,[SNPDF(X)] = b.[SNPDF(X)]
    ,[CDF(X)]   = d.[F(X)]
FROM SampleData a
-- Use NORMAL_PDF to return PDF for standard normal distribution
CROSS APPLY dbo.NORMAL_PDF(a.X, a.Mean, a.StdDev) b
-- Use Excel_NORM_DIST to return PDF for general normal distribution
CROSS APPLY dbo.Excel_NORM_DIST(a.X, a.Mean, a.StdDev, 0, DEFAULT) c
-- Use Excel_NORM_DIST to return CDF for a general normal distribution
CROSS APPLY dbo.Excel_NORM_DIST(a.X, a.Mean, a.StdDev, 1
    -- Increase the accuracy by specifying a larger number for fifth parameter
    ,CASE a.Mean WHEN 10 THEN 500 ELSE 100 END) d;
Note how we can override (using the fifth parameter to the function) the number of intervals, or just let it use the DEFAULT (which is 100 per standard deviation). You need to take some care with this because if you end up trying to calculate the CDF for an X that is a significant number of standard deviations away using a high interval count, you could exceed the number of rows generated by the in-line tally table. But you can always make that tally table generate more rows by adding additional CROSS JOINs. Just remember that as you evaluate more and more intervals, the performance of the iTVF will be degraded, so my advice is to use just what you need to achieve the accuracy you seek.
The final results from this query are:
X      Mean  StdDev  NPDF(X)               SNPDF(X)              CDF(X)
-1.00  2     0.5     1.21517656996466E-08  0.241970724519143     9.86435766403559E-10
-0.50  2     0.5     2.9734390294686E-06   0.3520653267643       2.86620600586929E-07
0.00   2     0.5     0.000267660451529771  0.398942280401433     3.16690114139928E-05
0.50   2     0.5     0.00886369682387602   0.3520653267643       0.00134984263449417
1.00   2     0.5     0.107981933026376     0.241970724519143     0.0227496820247703
1.50   2     0.5     0.483941449038287     0.129517595665892     0.158654245714223
2.00   2     0.5     0.797884560802865     0.0539909665131881    0.5
2.50   2     0.5     0.483941449038287     0.0175283004935685    0.841345754285777
3.00   2     0.5     0.107981933026376     0.00443184841193801   0.97725031797523
3.50   2     0.5     0.00886369682387602   0.00087268269504576   0.998650157365506
4.00   2     0.5     0.000267660451529771  0.000133830225764885  0.999968330988586
2.33   10    5.0     0.0246013380403521    0.0264264854972617    0.0625147949422269
4.22   10    5.0     0.0409033036384656    5.41832610895401E-05  0.123840539089739
5.10   10    5.0     0.0493618981134085    8.97243516238334E-07  0.163543019015466
8.20   10    5.0     0.0747821210746257    9.99837874849718E-16  0.359423544347365
10.00  10    5.0     0.0797884560802865    7.69459862670642E-23  0.5
11.50  10    5.0     0.0762775630921048    7.6416554115872E-30   0.61791144125835
12.60  10    5.0     0.0696985025517949    1.33848679925429E-35  0.697770895452422
16.80  10    5.0     0.0316449580740766    2.05718230302861E-62  0.913085073917205
22.50  10    5.0     0.00350566009871371   4.67863681725005E-111 0.99379034197768
The first thing that we notice about these results is that our CDF where X equals the mean is 0.5. That’s a good start, but for a more thorough check we’ll copy/paste these results into our Excel spreadsheet.

Notice how all of the values in column M are quite small (nearly zero), indicating a pretty small difference between Excel’s calculated CDF and the one calculated in T-SQL. Had we left the second distribution group to default to 100 intervals, the difference would have been slightly larger.
Conclusions
I’ll number my conclusions:
- I am a T-SQL geek, because whom but a T-SQL geek would have thought of doing something so ridiculously geeky and so enjoyed writing about it as much as me!
- It is possible to do integration (specifically to solve for a finite definite integral) in T-SQL by using a tally table to implement the fundamental theorem of calculus.
- We have provided two functions:
- The first, NORMAL_PDF, which calculates the value for the probability density function for both general and standard normal distributions.
- The second, EXCEL_NORM_DIST, which calculates the probability density and cumulative distribution functions for a general normal distribution, closely replicating the results of Excel’s NORM.DIST function.
Prior to writing this blog, I did a little searching to see if anyone has tried this before and I ran across this article by Eli Algranti: Part 1: T-SQL Implementation of NORMDIST / NORM.S.DIST
He is obviously a bit more of a mathematician than I am, because he came up with three different implementations that have different error characteristics for the CDF.
- Using polynomial approximation – certainly an interesting approach that uses an approximate “closed form” version of the antiderivative of the normal distribution. My only issue with it is that is uses a scalar-valued, user-defined function (UDF) to perform the calculation.
- Another polynomial approximation – similar to the first but with a different error result. Again, my issue is his implementation using the scalar-valued, UDF.
- Using a rational polynomial approximation – a bit more elaborate estimation approach that once again is implemented using a scalar-valued, UDF.
Certainly all of those could be converted to iTVFs that would run faster. It would be interesting to see how well my function’s error results compare to those.
Below is an Excel workbook file provided to you as a resource. In that you’ll find three worksheets:
- Final Results w-Check – showing the spreadsheet screen captures above (all columns), plus a column that contains a neat way to translate sample data from Excel to a series of T-SQL SELECT/UNION ALL/SELECT statements, like you see in my SampleDate CTEs above.
- SQL- Create-run NORMAL_PDF – a T-SQL script to create the named function (in italics) and run it with the sample data provided.
- SQL- Create-run EXCEL_NORM_DIST – a T-SQL script to create the named function (in italics) and run it with the sample data provided.
The normal distribution is one that is quite important in statistics and having tools to apply its distributions in T-SQL can be just as important. We hope you’ve found today’s blog useful and instructive!
Follow me on Twitter: @DwainCSQL
© Copyright Dwain Camps 14 May 2015. All rights reserved.
