

As someone who just crossed three decades of working in technology – I have a sudden renewed interest in understanding how careers in technology evolve with age or years of experience. Those of us older in this industry are among the first generation who have worked almost an entire career in technology. We do not have a lot of examples before us to understand how people worked this out as they got older. I wanted to play with the data generated by the survey Brent Ozar did for some of these reasons. The questions I was looking at are as below:
1 Is there any correlation between experience and number of hours worked?
2 Is there any correlation between experience and job duties/kinds of tasks performed?
3 Is there any correlation between experience and managing staff – ie – do more people with experience take to management as a form of progress?
I am using this blog post to explore question 1.
I imported the data from the spreadsheet into a sql server database. I then wanted to understand first if the data fit a normal distribution. If it did, what is the correlation between number of years worked (a continues variable), and number of hours currently clocking on the job (another continues variable). I removed the data that is invalid (0 hours of work). Also did not filter by country as I do not think these questions are very country specific.
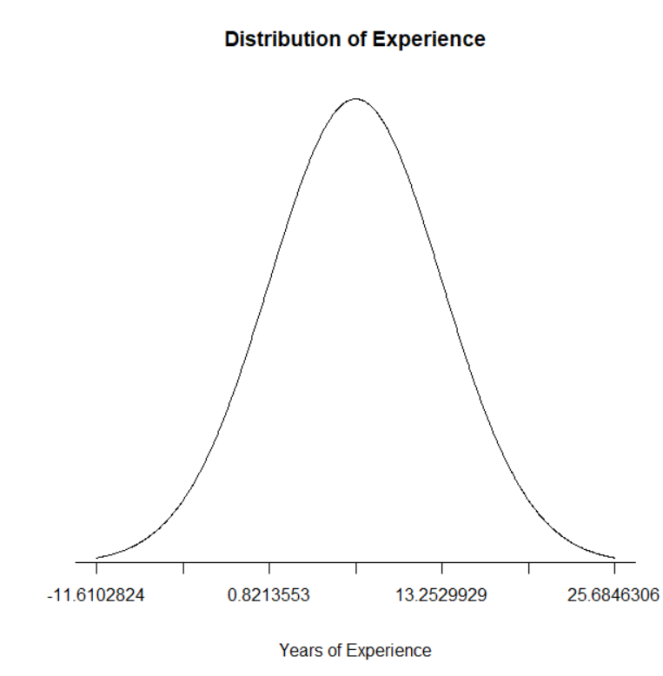
Step 1: Is the data a normal distribution?
The simplest way to determine this is if the data follows a bell curve. I used the simple R code below to determine this ,and I got a near perfect bell curve. So..good!
library(RODBC)

cn <- odbcDriverConnect(connection="Driver={SQL Server Native Client 11.0};server=DESKTOP;database=Salarysurvey;Uid=sa;Pwd=mypwd")
data <- sqlQuery(cn, 'select yearswiththistypeofjob from [dbo].[salarysurvey] where yearswiththistypeofjob > 0')
yearswiththistypeofjobmean<-mean(data$yearswiththistypeofjob)
yearswiththistypeofjobsd<-sd(data$yearswiththistypeofjob)
sigma1<-(sum(data$yearswiththistypeofjob>=yearswiththistypeofjobmean-yearswiththistypeofjobsd & data$yearswiththistypeofjob<=yearswiththistypeofjobmean+yearswiththistypeofjobsd)/length(data$yearswiththistypeofjob))*100
sigma2<-(sum(data$yearswiththistypeofjob>=yearswiththistypeofjobmean-(2*yearswiththistypeofjobsd) & data$yearswiththistypeofjob<=yearswiththistypeofjobmean+(2*yearswiththistypeofjobsd))/length(data$yearswiththistypeofjob))*100
sigma3<-(sum(data$yearswiththistypeofjob>=yearswiththistypeofjobmean-(3*yearswiththistypeofjobsd) & data$yearswiththistypeofjob<=yearswiththistypeofjobmean+(3*yearswiththistypeofjobsd))/length(data$yearswiththistypeofjob))*100
cat('Percentyearswiththistypeofjob in one SD FROM mean:',sigma1)
cat('Percentyearswiththistypeofjob in two SD FROM mean:',sigma2)
cat('Percentyearswiththistypeofjob in three SD FROM mean:',sigma3)
lower_bound <- yearswiththistypeofjobmean - yearswiththistypeofjobsd * 3
upper_bound <- yearswiththistypeofjobmean + yearswiththistypeofjobsd * 3
x <- seq(-3, 3, length = 1000) * yearswiththistypeofjobsd + yearswiththistypeofjobmean
y <- dnorm(x, yearswiththistypeofjobmean, yearswiththistypeofjobsd)
plot(x, y, type="n", xlab = "Years of Experience", ylab = "", main = "Distribution of Experience", axes = FALSE)
lines(x, y)
sd_axis_bounds = 5
axis_bounds <- seq(-sd_axis_bounds * yearswiththistypeofjobsd + yearswiththistypeofjobmean, sd_axis_bounds * yearswiththistypeofjobsd + yearswiththistypeofjobmean, by = yearswiththistypeofjobsd)
axis(side = 1, at = axis_bounds, pos = 0)
2 Now onwards to understand if there is any correlation between the two continues variables – years of experience and hours worked on the job. To do this I applied Pearson’s coefficient – I have a very detailed blog post on what that is here. Basically, this value is very easy to calculate in R and it can be interpreted as below:
A value of 1 indicates that there is a strong positive correlation(the two variables in question increase together), 0 indicates no correlation between them, and -1 indicates a strong negative correlation (the two variables decrease together). But you rarely get a perfect -1, 0 or 1. Most values are fractional and interpreted as follows:
| +.70 or higher | Very strong positive relationship |
| +.40 to +.69 | Strong positive relationship |
| +.30 to +.39 | Moderate positive relationship |
| +.20 to +.29 | weak positive relationship |
| +.01 to +.19 | No or negligible relationship |
| 0 | No relationship [zero correlation] |
| -.01 to -.19 | No or negligible relationship |
| -.20 to -.29 | weak negative relationship |
| -.30 to -.39 | Moderate negative relationship |
| -.40 to -.69 | Strong negative relationship |
| -.70 or higher | Very strong negative relationship |
So when I run the formula to calculate it in R –
data <- sqlQuery(cn, 'SELECT hoursworkedperweek,yearswiththistypeofjob from [dbo].[salarysurvey] where yearswiththistypeofjob > 0')
cor(data)
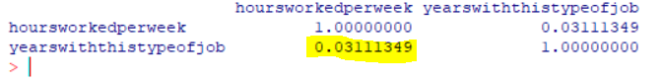
The value we get is 0.03, which suggests ‘no or negligible relationship’. So , the data does not suggest any relationship between years of experience and hours on the job. There may be a third variable to consider. Also to look into are the other two questions regarding nature of tasks. More on that in the next blog post..thanks for reading!
