

Something I always stress to people when I write and present is the importance of tracking data *before* you need it. Microsoft does a fair job collecting some data via DMVs, the default trace, and Extended Events, but the data is still very limited in many ways, and in many cases the data doesn't persist past a SQL service restart.
One of the important tools for a SQL Server DBA (or Dev, or Analyst, or...) is Windows Perfmon. Perfmon can be configured to track a ton of data, but it doesn't collect anything unless you are actively watching via the Perfmon GUI or you have configured a Perfmon Collector.
One of the downsides to Perfmon, like most other monitoring tools, is performance overhead. The more frequently you measure data, the more impactful it can be.
 |
| https://33.media.tumblr.com/871fe906d55f4f01872fd65482f94a8a/tumblr_inline_njxqxpHf471s778iq.jpg |
Because of this, I set up my collector to gather data every five minutes to lessen that impact. This number is a happy medium from past discussions with other colleagues for a number that is frequent enough to notice trends over time while still being infrequent enough to have minimal impact. Every five minutes may strike you as liable to miss problems, and it can - if something spikes (or valleys) for a moment - or even a minute or two - you may not see it. For many Perfmon counters however, you will see an extreme followed by a gradual change like this image from my recent "Server Using All of my RAM" blog post:

As you can see, Page Life Expectancy (PLE) on this graph dips, gradually climbs, and then dips again. With a collection every five minutes you may not catch the exact peak - all you know is that the PLE was 50,000 at 12:55am and then only 100 at 1:00am on 03/13. It may have climbed higher than that before it dipped, but by 1:00am it had dipped down to around 100 (coincidentally at 1am the CheckDB job had kicked off on a large database).
If you really need to know (in this example) exactly how high PLE gets before it dips, or exactly how low it dips, or at what specific time it valleys or dips, you need to actively watch or set up a collector with a more frequent collection. You will find that in most cases this absolute value isn't important - it is sufficient to know that a certain item peaks/valleys in a certain five minute interval, or that during a certain five minute interval ("The server was slow last night at 3am") a value was in an acceptable/unacceptable range.
If you do set up a collector with a more frequent interval, make sure to delete it (or at least turn it off) after you have collected your data. I am a fan of deleting it outright so that it doesn't accidentally get turned back on and cause impact, but sometimes it does make more sense to leave it in place. #ItDepends
--
My mechanism (not originally created by me but significantly modified from the original source material - I do not know who was the original author) uses a folder structure that I can ZIP and then unzip into C:\Perflogs, with batch files to create the collector and manage it via Windows Scheduled tasks.
Here are the counters I collect by default:
- "\Memory\Available MBytes"
- "\Memory\Pages/sec"
- "\MSSQLSERVER:Access Methods\Forwarded Records/sec"
- "\MSSQLSERVER:Access Methods\Full Scans/sec"
- "\MSSQLSERVER:Access Methods\Index Searches/sec"
- "\MSSQLSERVER:Buffer Manager\Buffer cache hit ratio"
- "\MSSQLSERVER:Buffer Manager\Free List Stalls/sec"
- "\MSSQLSERVER:Buffer Manager\Free pages"
- "\MSSQLSERVER:Buffer Manager\Lazy writes/sec"
- "\MSSQLSERVER:Buffer Manager\Page life expectancy"
- "\MSSQLSERVER:Buffer Manager\Page reads/sec"
- "\MSSQLSERVER:Buffer Manager\Page writes/sec"
- "\MSSQLSERVER:General Statistics\User Connections"
- "\MSSQLSERVER:Latches(*)\Latch Waits/sec"
- "\MSSQLSERVER:Locks(*)\Lock Waits/sec"
- "\MSSQLSERVER:Locks(*)\Number of Deadlocks/sec"
- "\MSSQLSERVER:Memory Manager\Target Server Memory (KB)"
- "\MSSQLSERVER:Memory Manager\Total Server Memory (KB)"
- "\MSSQLSERVER:SQL Statistics\Batch Requests/sec"
- "\MSSQLSERVER:SQL Statistics\SQL Compilations/sec"
- "\MSSQLSERVER:SQL Statistics\SQL Re-Compilations/sec"
- "\Paging File(*)\% Usage"
- "\PhysicalDisk(*)\Avg. Disk sec/Read"
- "\PhysicalDisk(*)\Avg. Disk sec/Write"
- "\PhysicalDisk(*)\Disk Reads/sec"
- "\PhysicalDisk(*)\Disk Writes/sec"
- "\Process(sqlservr)\% Privileged Time"
- "\Process(sqlservr)\% Processor Time"
- "\Processor(*)\% Privileged Time"
- "\Processor(*)\% Processor Time"
- "\SQLSERVER:Access Methods\Forwarded Records/sec"
- "\SQLSERVER:Access Methods\Full Scans/sec"
- "\SQLSERVER:Access Methods\Index Searches/sec"
- "\SQLSERVER:Buffer Manager\Buffer cache hit ratio"
- "\SQLSERVER:Buffer Manager\Free List Stalls/sec"
- "\SQLSERVER:Buffer Manager\Free pages"
- "\SQLSERVER:Buffer Manager\Lazy writes/sec"
- "\SQLSERVER:Buffer Manager\Page life expectancy"
- "\SQLSERVER:Buffer Manager\Page reads/sec"
- "\SQLSERVER:Buffer Manager\Page writes/sec"
- "\SQLSERVER:General Statistics\User Connections"
- "\SQLSERVER:Latches(*)\Latch Waits/sec"
- "\SQLSERVER:Locks(*)\Lock Waits/sec"
- "\SQLSERVER:Locks(*)\Number of Deadlocks/sec"
- "\SQLSERVER:Memory Manager\Target Server Memory (KB)"
- "\SQLSERVER:Memory Manager\Total Server Memory (KB)"
- "\SQLSERVER:SQL Statistics\Batch Requests/sec"
- "\SQLSERVER:SQL Statistics\SQL Compilations/sec"
- "\SQLSERVER:SQL Statistics\SQL Re-Compilations/sec"
- "\System\Processor Queue Length"
As you can see there is duplication between MSSQLSERVER counters and SQLSERVER counters - this is because at some version of SQL the hive name changed from MSSQLSERVER to SQLSERVER, and by including both of them in the list it covers all of the bases regardless of the Windows/SQL Server version being monitored. If the listed hive doesn't exist, the collector creates without error, so it doesn't hurt to have both of them in the list.
This is my default list, curated over time from experiences and input from others - if you have other counters you want to collect just edit the list accordingly.
One note - if you have a named instance, the counter hive will be named differently - something like MSSQL$instancename. The easiest way to handle this is to edit the counter list, copy-paste the SQLSERVER counter list, and then find-replace SQLSERVER to MSSQL$instancename for the new items.
--
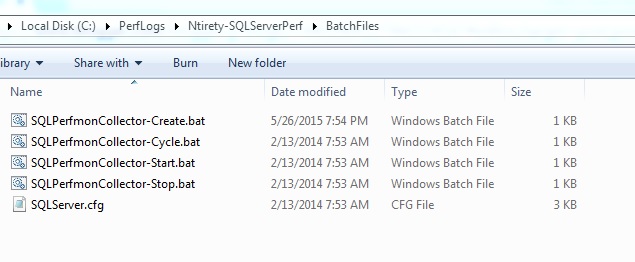
The folder structure starts at the top level with a folder named SQLServerPerf (in my case Ntirety-SQLServerPerf). Below that are two folders, SQLServerPerf\BatchFiles and SQLServerPerf\Logs.
By default, the Logs folder is empty, In BatchFiles are five files - a .CFG file that includes the counter list above, and four .BAT files to create/start/stop/cycle the collector itself.
To start, unzip the package (or copy the SQLServerPerf folder) into C:\PerfLogs, resulting in C:\PerfLogs\SQLServerPerf\
Why do I use C:? By default Windows creates a PerfLogs folder there, plus using that path guarantees (almost guarantees) that the batch files will run since Windows servers in general have C: drives - using a different drive would require edits to the files to reference that different drive, and it you absolutely can't write to C: that is the fix - edit the files to change references from C: to the drive of your choice.
--
SQLServerPerf\BatchFiles\SQLServer.CFG is a text file whose contents are just the counter list:
"\Memory\Available MBytes"
"\Memory\Pages/sec"
"\MSSQLSERVER:Access Methods\Forwarded Records/sec"
"\MSSQLSERVER:Access Methods\Full Scans/sec"
"\MSSQLSERVER:Access Methods\Index Searches/sec"
"\MSSQLSERVER:Buffer Manager\Buffer cache hit ratio"
"\MSSQLSERVER:Buffer Manager\Free List Stalls/sec"
"\MSSQLSERVER:Buffer Manager\Free pages"
"\MSSQLSERVER:Buffer Manager\Lazy writes/sec"
"\MSSQLSERVER:Buffer Manager\Page life expectancy"
"\MSSQLSERVER:Buffer Manager\Page reads/sec"
"\MSSQLSERVER:Buffer Manager\Page writes/sec"
"\MSSQLSERVER:General Statistics\User Connections"
"\MSSQLSERVER:Latches(*)\Latch Waits/sec"
"\MSSQLSERVER:Locks(*)\Lock Waits/sec"
"\MSSQLSERVER:Locks(*)\Number of Deadlocks/sec"
"\MSSQLSERVER:Memory Manager\Target Server Memory (KB)"
"\MSSQLSERVER:Memory Manager\Total Server Memory (KB)"
"\MSSQLSERVER:SQL Statistics\Batch Requests/sec"
"\MSSQLSERVER:SQL Statistics\SQL Compilations/sec"
"\MSSQLSERVER:SQL Statistics\SQL Re-Compilations/sec"
"\Paging File(*)\% Usage"
"\PhysicalDisk(*)\Avg. Disk sec/Read"
"\PhysicalDisk(*)\Avg. Disk sec/Write"
"\PhysicalDisk(*)\Disk Reads/sec"
"\PhysicalDisk(*)\Disk Writes/sec"
"\Process(sqlservr)\% Privileged Time"
"\Process(sqlservr)\% Processor Time"
"\Processor(*)\% Privileged Time"
"\Processor(*)\% Processor Time"
"\SQLSERVER:Access Methods\Forwarded Records/sec"
"\SQLSERVER:Access Methods\Full Scans/sec"
"\SQLSERVER:Access Methods\Index Searches/sec"
"\SQLSERVER:Buffer Manager\Buffer cache hit ratio"
"\SQLSERVER:Buffer Manager\Free List Stalls/sec"
"\SQLSERVER:Buffer Manager\Free pages"
"\SQLSERVER:Buffer Manager\Lazy writes/sec"
"\SQLSERVER:Buffer Manager\Page life expectancy"
"\SQLSERVER:Buffer Manager\Page reads/sec"
"\SQLSERVER:Buffer Manager\Page writes/sec"
"\SQLSERVER:General Statistics\User Connections"
"\SQLSERVER:Latches(*)\Latch Waits/sec"
"\SQLSERVER:Locks(*)\Lock Waits/sec"
"\SQLSERVER:Locks(*)\Number of Deadlocks/sec"
"\SQLSERVER:Memory Manager\Target Server Memory (KB)"
"\SQLSERVER:Memory Manager\Total Server Memory (KB)"
"\SQLSERVER:SQL Statistics\Batch Requests/sec"
"\SQLSERVER:SQL Statistics\SQL Compilations/sec"
"\SQLSERVER:SQL Statistics\SQL Re-Compilations/sec"
"\System\Processor Queue Length"
--
SQLServerPerf\BatchFiles\SQLPerfmonCollector-Create.bat is a batch (text) file whose contents create the collector and also several Windows Scheduled Tasks that manage the collector:
logman create counter SQLServerPerf -f bin -si 300 -v nnnnnn -o "c:\perflogs\SQLServerPerf\Logs\SQLServerPerf" -cf "c:\perflogs\SQLServerPerf\BatchFiles\SQLServer.cfg"
timeout /T 2
logman start SQLServerPerf
timeout /T 2
schtasks /create /tn "Cycle SQLServerPerf Perfmon Counter Log" /tr C:\PerfLogs\SQLServerPerf\BatchFiles\SQLPerfmonCollector-Cycle.bat /sc daily /st 23:59:58 /ed 01/01/2099 /ru system
timeout /T 2
schtasks /create /tn "Start SQLServerPerf Perfmon Counter Log" /tr C:\PerfLogs\SQLServerPerf\BatchFiles\SQLPerfmonCollector-Start.bat /sc onstart /ru system
timeout /T 2
schtasks /create /tn "Purge SQLServerPerf Perfmon Counter Log" /tr "PowerShell -command {Get-ChildItem -path C:\PerfLogs\SQLServerPerf\Logs -Filter *.blg | where {$_.Lastwritetime -lt (date).addmonths(-13)} | remove-item}" /sc daily /st 23:59:58 /ed 01/01/2099 /ru system
pause
As you can see there are references to the direct path to our C:\PerfLogs\SQLServerPerf - if you move the files to another drive/path, these references need to be changed.
This batch file does the following:
- Uses "logman create" to create the actual collector, writing files to to the Logs folder and gathering the counters listed in the SQLServer.cfg file
- Uses "timeout" to pause for two seconds to allow the user to see any return messages
- Uses "logman start" to start the collector
- Pauses two more seconds
- Uses "schtasks /create" to create a scheduled task to run SQLPerfmonCollector-Cycle.bat nightly at 11:59:58pm (Batch file contents to follow)
- Pauses two more seconds
- Uses "schtasks /create" to create a scheduled task to run SQLPerfmonCollector-Start.bat on system startup - this makes sure that after a reboot the collector is automatically started for minimal interruption
- Pauses two more seconds
- Uses "schtasks /create" to create a scheduled task to run nightly at 11:59:58pm to run a Powershell command to delete log (.BLG) files older than 13 months
- Uses "pause" to stop progress until the user hits a key - this again prevents the window from closing until the user acknowledges the progress
**Important Note** - current versions of Windows have settings for some of what I am using Scheduled Tasks to do, such as restarting the collector. This wasn't always the case, and I wanted a solution I could deploy without worrying about the Windows version.
--
SQLServerPerf\BatchFiles\SQLPerfmonCollector-Cycle.bat is a batch (text) file whose contents stop and then start the collector:
logman stop SQLServerPerf
timeout /T 2
logman start SQLServerPerf
logman start SQLServerPerf
logman stop SQLServerPerf
I included this for completeness when I was creating the batch files although I have yet to need it - if I want to stop the collector for some reason I simply do so interactively in the Perfmon GUI.
--
As noted above, I keep the SQLServerPerf folder as a ZIP, and then to deploy it I unzip it into C:\PerfLogs, and then run the Create batch file - it's a simple as that.
The output file from a Perfmon collector by default is a .BLG file. As noted above, there is a scheduled tasks to stop and start the collector every night, resulting in a new .BLG file each day:

To look at an individual day's info, you simply open that day's file in Perfmon (by opening Perfmon and then opening the file, or by double-clicking the BLG file itself). If you wish to string multiple days' data together, use the Relog command as I described in this post from a couple years ago: "Handling Perfmon Logs with Relog."
As you can see in the above screenshot, on my laptop the collector stores about 1MB per day. Even on a big OLTP production cluster I don't see more than 1.5MB-2.0MB/day. Stretch that out over 13 months (remember we purge files older than 13 months) and it comes out to a max size of around 800MB. Hopefully 1GB of Perfmon data isn't going to fill your C: drive (if it is you have other problems) but if it is going be a problem, relocate the folders as described above.
--
There are few things more important for *reacting* to problems than to be *proactively* gathering data - and a Perfmon collector helps you to do just that.
Hope this helps!
