

What is the difference between reading numbers as they are presented, and interpreting them in a mature, deeper way? One way perhaps to look at the latter is what statisticians call ‘confidence interval’.
Suppose I look at a sampling of 100 americans who are asked if they approve of the job the supreme court is doing. Let us say for simplicity’s sake that the only two answers possible are yes or no. Out of 100, say 40% say yes. As an ordinary person, you would think 40% of people just approve. But a deeper answer would be – the true proportion of americans who approve of the job the supreme court is doing is between x% and y%.
How confident I am that it is? About z%. (the common math used is 95%). That is an answer that is more reflective of the uncertainty related to questioning people and taking the answers to be what is truly reflective of an opinion. The x and y values make up what is called a ‘confidence interval’.
Let us illustrate this with an example.
From this article – out of a random sampling of 1089 people, 41% approved of the job the supreme court was doing. To construct the confidence interval, the first step is to determine if this sampling satisfies the needs for a normal distribution.
Step 1: Is the data from a normal distribution?
When we do not have the entire dataset with us, we use the below two rules to determine this:
1 The sample observations are independent – from the article it seems like random people were selected so this is safe to assume.
2 We need a minimum of 10 successes and 10 failures in the sample. – ie np >=10 and n(1-p) >= 10. This is called ‘success failure condition‘. Our n here is 1089, and p is 0.41. So successes are 1089*41 = 446.49 and failures are 642.5. Both are larger than 10, so we are good.
Step 2: Calculate standard error or standard deviation of the confidence interval is calculated as square root of p(1-p)/n. In this case it is square root of 0.41*0.59/1089 which is 0.0149.
Step 3: Find the right critical value to use – we want a 95% confidence in our estimates, so the critical value recommended for this is 1.96.
Step 4: Calculate confidence interval – Now we have all we need to calculate confidence interval. The formula to use is point estimate +- (critical value x standard error) which is 0.41 + (1.96*0.0149) = 0.4392, and 0.41 – (1.96*0.0149) = 0.3807.
So, we can say with 95% confidence that the true proportion of americans who approve of the supreme court is between 38.07% and 43.92%.
We can spare ourselves all this trouble by using a simple function in R as below, and we get the same results. We need to pass to this function what is 41% of 1089, which is 446.49.
Just typing prop.test(446.49, 1089) gets answers as below:
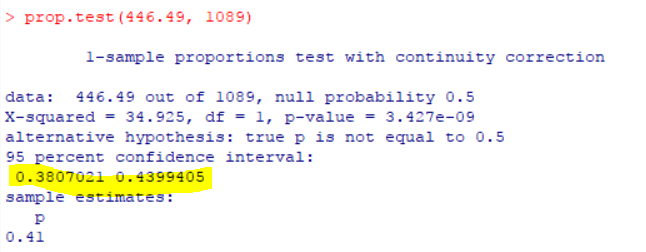
So, with just two figures – the sample count and percentage value, we were able to derive a deeper conclusion of what this data might mean. Thanks for reading!
