Continuation from the previous 94 parts, the whole series can be found at http://www.nikoport.com/columnstore/.
In this blog post I am continuing showing some of the solutions for the common problematic places for the Columnstore Indexes.
Here I will focus on 2 important aspects of the query execution plans that are using the Columnstore indexes:
– Non-Hash Joins
– Query construction (focus on the engine improvements)
This is not a complete list of the patterns that I am pretending to publish, more stuff will be added as soon, but these 2 are quite common in my experience.
Before advancing I will use my own generated copy of the TPCH database (1GB version), that I have done with the help of the HammerDB.
As usually, the location of my backup file is C:\Install and I will use the following script to restore and reconfigure the database on SQL Server 2016 instance by making sure that the compatibility level is set to 130:
/*
 * This script restores backup of the TPC-H Database from the C:\Install
 */USE [master]

if exists(select * from sys.databases where name = 'tpch')
begin
alter database [tpch]
set SINGLE_USER WITH ROLLBACK IMMEDIATE;
end

RESTORE DATABASE [tpch]
FROM  DISK = N'C:\Install\tpch_1gb_new.bak' WITH  FILE = 1, NOUNLOAD,  STATS = 1

alter database [tpch]
    set MULTI_USER;
GO

GO
ALTER DATABASE [tpch] SET COMPATIBILITY_LEVEL = 130
GO

USE [tpch]
GO
EXEC dbo.sp_changedbowner @loginame = N'sa', @map = false
GO

USE [master]
GO
ALTER DATABASE [tpch] MODIFY FILE ( NAME = N'tpch',  FILEGROWTH = 256152KB )
GO
ALTER DATABASE [tpch] MODIFY FILE ( NAME = N'tpch_log', SIZE = 1200152KB , FILEGROWTH = 256000KB )
Let’s convert 2 biggest tables of the TPCH (lineitem & orders) to the columnstore, by creating the copies of the respective tables with Clustered Columnstore Indexes:
USE [tpch]
GO

drop table if exists dbo.lineitem_cci;

-- Data Loding
SELECT [l_shipdate]
      ,[l_orderkey]
      ,[l_discount]
      ,[l_extendedprice]
      ,[l_suppkey]
      ,[l_quantity]
      ,[l_returnflag]
      ,[l_partkey]
      ,[l_linestatus]
      ,[l_tax]
      ,[l_commitdate]
      ,[l_receiptdate]
      ,[l_shipmode]
      ,[l_linenumber]
      ,[l_shipinstruct]
      ,[l_comment]
  into dbo.lineitem_cci
  FROM [dbo].[lineitem];
GO

-- Create Clustered Columnstore Index
create clustered columnstore index cci_lineitem_cci
on dbo.lineitem_cci;

USE [tpch]
GO

DROP TABLE IF EXISTS dbo.orders_cci;

SELECT [o_orderdate]
      ,[o_orderkey]
      ,[o_custkey]
      ,[o_orderpriority]
      ,[o_shippriority]
      ,[o_clerk]
      ,[o_orderstatus]
      ,[o_totalprice]
      ,[o_comment]
into dbo.orders_cci
  FROM [dbo].[orders];

create clustered columnstore index cci_orders_cci
on dbo.orders_cci;
GO
Non-Hash Joins
The importance of having Hash Joins in the SQL Server with the Columnstore Indexes can not be overstated. Unless you are processing very small amounts of data out of the Columnstore Indexes (under 1000), the only join type you will want to see is the HASH JOIN.
The difference can be abysmal in the terms of the used resources and overall performance that it will take you down not only on the level of the rowstore indexes, but because you might be dealing with the
Consider running the following query which is returning top 100 orders and the sum of the top 10 line item volume sales for each of the orders:
set statistics time, io on

select TOP 100
o_orderkey,
o.o_orderdate,
MAX(o.o_totalprice) as orderprice,
SUM(Volume) as Top10VolumeSales
from dbo.orders_cci o
cross apply ( select top 10 (l_extendedprice * (1 - l_discount)) as volume
from lineitem_cci li
where o_orderkey = li.l_orderkey
order by  (l_extendedprice * (1 - l_discount)) desc
 ) f
where o.o_orderstatus <> 'F'
group by o.o_orderdate, o_orderkey
ORDER BY SUM(o.o_totalprice) DESC
On my VM with 4 cores it takes 33 seconds to execute this query on SQL Server 2016 with Service Pack 1, while it burns almost 48 seconds of the CPU Time.
The relevant part of the execution plan can be found below,
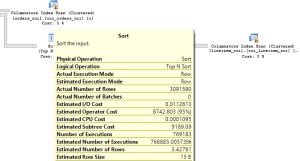
showing so many performance problems that this query is suffering, such as INNER LOOP JOIN, INDEX SPOOL, besides even worse part that is actually hidden and is identifiable only once you open the properties of any of the lower tree (left side of the LOOP JOIN), seeing that it all runs with the Row Execution Mode actually. To show you the problem, on the left side you will find the properties of the sort iterator that is to be found in the lower (left) part of the LOOP Join that was executed around 770.000 times in the Row Execution Mode, effectively taking any chances away from this query to be executed in a fast way. One might argue that it might that it might be more effective to do the loop part in Row Mode, but given that we are sorting around 3.1 Million Rows there – for me there is no doubt that it would be faster to do it within a Batch Execution Mode. Consulting the last sort iterator in the execution plan (TOP N SORT), you will find that it is running with the help of the Batch Execution Mode, even though it is processing around 770.000 rows.
One of the possible solutions that I see in such cases is to rewrite the query where possible without the CROSS APPLY part, thus enabling the query to be executed with the Batch Execution Mode completely by using HASH JOIN for the connection between the 2 tables:
set statistics time, io on

select TOP 100
o.o_orderkey,
o.o_orderdate,
MAX(o.o_totalprice) as orderprice,
SUM(Volume) as Top10Volume
from dbo.orders_cci o
inner join ( select ROW_NUMBER() OVER (PARTITION BY l_orderkey ORDER BY sum(l_extendedprice * (1 - l_discount)) desc) AS rowNumber,
sum(l_extendedprice * (1 - l_discount)) as volume,
li.l_orderkey
from lineitem_cci li
group by l_orderkey ) f
on o_orderkey = f.l_orderkey
where o.o_orderstatus <> 'F'
and rowNumber < 10
group by o.o_orderdate, o.o_orderkey
ORDER BY SUM(o.o_totalprice) DESC
Take a look at the relevant part of the execution plan below:
here we have every single iterator running in the Batch Execution Mode, making this query lightning fast to be executed under 1 seconds with just 2.8 seconds spent off the CPU time. There is no need to compare the performance of these 2 queries even though both of them are using Columnstore Indexes and the first one is using Batch Execution Mode in around 40% of the existing iterators.
Naturally it is not always possible to rewrite a complex DWH query in such a light way as in this example, but the idea here is to provide the tip that the LOOP join is typically not a good thing to be found within your execution plan with Columnstore Indexes when dealing with hundreds of thousands or millions of rows. There are times when Query Optimiser will select the LOOP JOIN because of the statistics distribution or any other possible reasons, and if there is nothing that you can do about it, then your natural option should be forcing the HASH JOIN with the OPTION (HASH JOIN) or HASH JOIN hints.
Another important aspect to notice here is that the CROSS APPLY does not automatically mean that the execution plan will use NESTED LOOP JOIN, please consider the notice the following query below which is using HASH JOINS and runs fast as it should:
select TOP 100
o_orderkey,
o.o_orderdate,
MAX(o.o_totalprice) as orderprice,
SUM(Volume) as VolumeSales
from dbo.orders_cci o
cross apply ( select (l_extendedprice * (1 - l_discount)) as volume
from lineitem_cci li
where o_orderkey = li.l_orderkey
 ) f
where o.o_orderstatus <> 'F'
group by o.o_orderdate, o_orderkey
ORDER BY SUM(o.o_totalprice) DESC;
Microsoft is working really hard on improving Query Optimiser with each version and any affirmations in the current times should be bound to the specific version of SQL Server or specific time when it was used at Azure SQL Database.
Query Construction – SQL Server 2016
An important aspect of the query writing for the Columnstore Indexes and the Batch Execution Mode is knowing where the current limits of the technology development are and which functionalities CAN actually perform faster. Knowing that you can extract better performance from a feature shall lead you into finding the ways of researching and finding a solution.
Consider calculating the sum of the Sales prices for our test database TPCH (Extended Price – Discount) and convert it to a different currency by using a constant (1.23) in the 2 distinct ways:
– First we shall calculate a distinct Sales Price per line item and multiply it to the currency converting currency, calculating the total sum over it
– Second way would be calculating the sum over the Sales Price per item and multiplied by the line item quantity and multiplying it by the currency constant:
set statistics time, io on

select sum((l_extendedprice - l_discount) *1.23 * l_quantity)
from [tpch].[dbo].[lineitem_cci];

select sum((l_extendedprice - l_discount)*l_quantity) * 1.23
from [tpch].[dbo].[lineitem_cci];
Looking at the amounts of the read accesses will tell you the story that the expected results are equal:
Table 'lineitem_cci'. Scan count 4, logical reads 0, physical reads 0, read-ahead reads 0, lob logical reads 8297, lob physical reads 0, lob read-ahead reads 0.
Table 'lineitem_cci'. Segment reads 13, segment skipped 0.
Table 'Worktable'. Scan count 0, logical reads 0, physical reads 0, read-ahead reads 0, lob logical reads 0, lob physical reads 0, lob read-ahead reads 0.
Are they really equal ?
The execution times will provide you with the details on the taken amount of time:
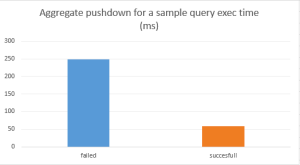
248ms for the first query vs 58ms for the second one – we are talking about almost 5 times improvement, but the real deal here is actually the spent CPU time:
720ms vs 141ms. Should I ran the query with a single thread, the difference would be even more visible (in my current setup I am using 4 cores).
To understand better what is going on here, consider the actual execution plans that are presented below:
 The real issue here is that in the first case the Query Optimiser is not able of passing the aggregate predicate pushdown, which is taking place in the second query, resulting in incapability of the Storage Engine to do the calculations for the first query – making it burning the CPU quite violently.
Comparing to the Row Storage & Row Execution Mode of the query will result in significant difference to the Batch Execution Mode, with CPU time being at least 3 times less significant.
Make sure that while writing your queries you understand & take the advantages of the recent improvements in the engine. There will be a number of the different features that will require query rewriting, and so you need to watch out if the Query Engine is giving you the best it can, or maybe your queries needs a little bit of rewriting in order to get some significant speed improvements.
Notice that both of these Aggregate Predicate Pushdown queries in the SQL Server vNext & Azure SQL Database are operating with the same speed, because of the Query Optimiser improvements, that are already available in the CTP 1.1 of the SQL Server vNext
to be continued with Columnstore Indexes – part 96 (“Nonclustered Columnstore Index Online Rebuild”)


