

[read this post on Mr. Fox SQL blog]
When it comes to deploying SQL Server onto an Azure IaaS VM, it is sometimes difficult to know the best option to deploy the SQL Server tempdb database for your workload.
In many of the SQL templates on the marketplace it is often deployed to the C:\ by default after which you should redeploy the database to either D:\ (local SSD) or to an attached premium disk (P10, P20, P30). The Microsoft SQL on IaaS Performance Best Practice article states both are possibilities under certain circumstances, however it does not provide empirical workload evidence as which to use when.
For those who have not seen the article – read here – https://azure.microsoft.com/en-us/documentation/articles/virtual-machines-windows-sql-performance/
The key comment of interest is this…
For D-series, Dv2-series, and G-series VMs, the temporary drive on these VMs is SSD-based. If your workload makes heavy use of TempDB (e.g. for temporary objects or complex joins), storing TempDB on the D drive could result in higher TempDB throughput and lower TempDB latency.
…and this…
For VMs that support Premium Storage (DS-series, DSv2-series, and GS-series), we recommend storing TempDB and/or Buffer Pool Extensions on a disk that supports Premium Storage with read caching enabled. There is one exception to this recommendation; if your TempDB usage is write-intensive, you can achieve higher performance by storing TempDB on the local D drive, which is also SSD-based on these machine sizes.
So I thought lets test a OLTP type SQL workload!
AND SO – lets do some testing to validate this puppy!
Preparing the Environment
First Lets get everything we need to run our tests;
- The core of my tests were performed on an Azure DS3 VM (7GB RAM / 2 cores) from the marketplace with SQL Server 2016 Enterprise (RTM).
- I set the max SQL memory to only 512MB (to at least force some IO to the drive)
- I deployed a single P30 premium disk (5000 IOPS / 200MB/sec) – mainly as they are significantly faster than P10 (500IOPS / 100MB/sec).
- Read caching is enabled on the disks.
- The Windows page file has been moved off D:\
- All disks are formatted using 64KB allocation
- Increased the TempDB size and added an additional data files (so we align 1x data file to 1x core). The SQL Script used to expand and move the TempDB database from C:\ to D:\ (which is the local SSD) is below.
- All other SQL Server services except the Database Service have been stopped.
NOTE that before you can move TempDB to D:\ you need to grant the account that runs the SQL Server database engine with FULL permissions on the root of D:\ so it can create the new database files
-- MOVE TEMP TO D:USE master;
GO
ALTER DATABASE tempdb MODIFY FILE (NAME = tempdev, FILENAME = 'D:\tempdb.mdf');
GO
ALTER DATABASE tempdb MODIFY FILE (NAME = templog, FILENAME = 'D:\templog.ldf');
GO

 -- ADD NEW FILE AND RESIZE TEMPDB
GO
ALTER DATABASE [tempdb] ADD FILE ( NAME = N'temp', FILENAME = N'D:\tempdb2.ndf' , SIZE = 3170304KB , FILEGROWTH = 65536KB )
GO
ALTER DATABASE [tempdb] MODIFY FILE ( NAME = N'tempdev', SIZE = 3170304KB )
GO
ALTER DATABASE [tempdb] MODIFY FILE ( NAME = N'templog', SIZE = 3170304KB )
GO
Preparing and Running the Test
To test an OLTP type throughput I will run a test with the TempDB database on D:\ (local SSD) and then rerun the test again with the TempDB moved onto F:\ (P30 premium disk). Between the tests SQL Server is restarted so we’re starting with a clean cache and state.
The test SQL script will create a table in TempDB and then run an iterative set of insert, update, select and delete queries against that table. We’ll then capture and record the throughput, statistics and time. I ran each test 2 times and took the averages.
This test is meant to simulate a OLTP type workload with lots of individual SQL statements. For people testing for DW workloads you would probably want to change it to have more large set based work, joins, sorts etc.
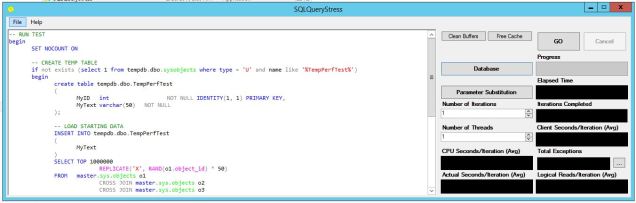
I will use the classic SQLQueryStress tool to do my tests and rollup stats collection – for those who want to grab this tool its here on github. The tool was originally developed by Adam Machanic. https://github.com/ErikEJ/SqlQueryStress
I am adapting a clever method highlighted by Brent Ozar for leveraging the tool to create a Production like performance load, however in my case I dont want it to be random but need it to be a repeatable test – see this article for more info – https://www.brentozar.com/archive/2015/05/how-to-fake-load-tests-with-sqlquerystress/
(Note to Self – In hindsight I probably should have just written a more simple repeatable script, but hey the end game is the same!)
The SQLQueryStress tool is run on the VM and is connected to the localhost and the TempDB database. Only a single thread and iteration are configured for the tests.
The test SQL Test Script being run executes 100,000 iterations of the various database calls against a table with 1,000,000 rows (or about 2GB of data – 4x times the SQL cache size).
-- RUN TEST
begin
 SET NOCOUNT ON

 -- CREATE TEMP TABLE
 if not exists (select 1 from tempdb.dbo.sysobjects where type = 'U' and name like '%TempPerfTest%')
 begin
 create table tempdb.dbo.TempPerfTest
 (
 MyID int NOT NULL IDENTITY(1, 1) PRIMARY KEY,
 MyText char(2000) NOT NULL
 );

 -- LOAD STARTING DATA
 INSERT INTO tempdb.dbo.TempPerfTest
 (
 MyText
 )
 SELECT TOP 1000000
 'X'
 FROM master.sys.objects o1
 CROSS JOIN master.sys.objects o2
 CROSS JOIN master.sys.objects o3
 ;
 end

 DECLARE @Id INT = 0

 WHILE (@Id < 100000)
 begin
 IF @Id % 4 = 0 -- SELECT
 SELECT * FROM tempdb.dbo.TempPerfTest WHERE MyID = (@Id * 10)
 ELSE IF @Id % 3 = 0 -- INSERT
 INSERT INTO tempdb.dbo.TempPerfTest (MyText) SELECT 'X'
 ELSE IF @Id % 2 = 0 -- UPDATE
 UPDATE tempdb.dbo.TempPerfTest SET MyText = 'X' WHERE MyID = (@Id * 6)
 ELSE -- DELETE
 DELETE FROM tempdb.dbo.TempPerfTest WHERE MyID = (@Id * 3)

 SET @Id = @Id + 1
 end
end
Due to an odd quirk in the tool (which I couldn’t work out) I had to use a permanent temporary table instead of a traditional # table. But hey, its the same for both tests.
Test Results
And so the results are in for the 100,000 iterations (over a 1,000,000 row table)
| Test Type (Each test run 2x times) | AVG Elapsed Time (Sec) | AVG Logical Reads | AVG MB/Sec |
| TempDB on D:\ (SSD) | 157 | 1,773,755 | 52.85 |
| TempDB on F:\ (P30) | 164 | 1,773,755 | 51.60 |
Key Summary
The findings show some interesting things.
- The workload has a large IO spike at the start as it loads 1,000,000 rows into the table – which then drops and steadies out as it runs the 100,000 individual transactions. The workload graph on both were actually slightly different.
- My workload executed on average about 4% faster on the local SSD than on the single P30. (Some tests were so close as to be almost statistically insignificant.)
- The Avg MB/Sec was about the same (a tad slower on the P30) – though either test didn’t push over 850 IOPS (@ 64KB per IO). This is OK as the point was NOT to stress the disk (I can use IOMeter for that!) – but to instead get a feel on how a simulated workload would perform.
- The only conclusion I can draw is the (cumulative) latency for my specific workload type must be marginally higher on the Premium P30. (Which I was kind of expecting).
- The difference is small for this workload – so it really comes down to if you are looking to squeeze a little bit more performance out of your application vs having to deal with the temporary nature of the local D:\ SSD drive. For those wanting to do this – this article shows how to manage a SQL TempDB on local SSD – https://blogs.technet.microsoft.com/dataplatforminsider/2014/09/25/using-ssds-in-azure-vms-to-store-sql-server-tempdb-and-buffer-pool-extensions/
- I didn’t try multiple P30 in a set, however its a fair assumption that adding just a single additional dedicated premium disk on F:\ for TempDB will beat the local SSD performance. Maybe a test for another day!
- I didn’t try different workload mixes, such as all writes, all reads, or larger set based work, but again its a fair assumption that a different mix will produce different performance results.
And as I always say, please test this yourself as your workload may vary which of course means your mileage may vary!
Disclaimer: all content on Mr. Fox SQL blog is subject to the disclaimer found here
