

This is the fifth article in a short series of SQL Server query challenges to test and expand your SQL Server querying skills. While none of these short articles is of overwhelming complexity, they will hopefully either teach you something new or help you to reactivate potentially dormant SQL skills in preparation for your next real-world challenge. You can see the rest of the articles on the Query Answers with SQL Server page.
In this article we will once again imagine that you are working for a small classic car retailer called Prestige Cars Ltd, using the data that is in the company database.
The Challenge
Seasonal variations can often be very revealing, or at least this is what the CFO thinks. He has asked you to provide some analysis of like-for-like sales so he can see the average sales by color for the same month in both the previous year and the current year. The following code lets you keep him happy:
SELECT     ST.Color, AVG(SA.TotalSalePrice) AS AverageMonthSales
           ,MAX(AveragePreviousMonthSales) AS AveragePreviousYearMonthSales
FROM       Data.Make AS MK
INNER JOIN Data.Model AS MD ON MK.MakeID = MD.MakeID
INNER JOIN Data.Stock AS ST ON ST.ModelID = MD.ModelID
INNER JOIN Data.SalesDetails SD ON ST.StockCode = SD.StockID
INNER JOIN Data.Sales AS SA ON SA.SalesID = SD.SalesID
           LEFT OUTER JOIN
                      (
                       SELECT     Color, AVG(SA.TotalSalePrice)
                                  AS AveragePreviousMonthSales
                       FROM       Data.Make AS MK
                       INNER JOIN Data.Model AS MD
                                  ON MK.MakeID = MD.MakeID
                       INNER JOIN Data.Stock AS ST
                                  ON ST.ModelID = MD.ModelID
                       INNER JOIN Data.SalesDetails SD
                                  ON ST.StockCode = SD.StockID
                       INNER JOIN Data.Sales AS SA
                                  ON SA.SalesID = SD.SalesID
                       WHERE      YEAR(SA.SaleDate) = YEAR(GETDATE()) - 1
                                  AND MONTH(SA.SaleDate) = MONTH(GETDATE())
                       GROUP BY   Color
                      ) SQ
               ON SQ.Color = ST.Color
WHERE      YEAR(SA.SaleDate) = YEAR(GETDATE())
           AND MONTH(SA.SaleDate) = MONTH(GETDATE())
GROUP BY   St.Color
Running this query gives the results that you can see in Figure 1—if you run the code in August 2018. For other dates, you get different results.
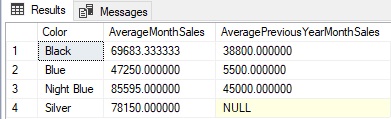
Figure 1. Displaying figures for a parallel time period using a derived table
How It Works
This query is in two main parts:
A derived table
That calculates the sales by color for the same month in the previous year.
An outer query
That calculates the sales by color for the current month and year.
Each of these elements uses the same core query. First the Make, Model, Stock, SalesDetails, and Sales tables are joined. Then the Color field is added to the SELECT and GROUP BY clauses to aggregate data by color. Finally, the average sale price is calculated. The only real difference is that the derived table (the inner query) looks at last year’s data. This is done by adjusting the GETDATE() function for the year so that it reads
YEAR(GETDATE()) - 1
Then the two parts of the query are joined. We do this using a LEFT OUTER JOIN to ensure that all the colors for sales this year will be shown. If you use an INNER JOIN instead, then you will not see any colors that sold this year but not last year. Remember that the LEFT OUTER JOIN means “all records from the first dataset, including any that match from the second dataset.”
Finally, you added the average sale price for last year’s sales to the outer query. However, as this, too, is an aggregate query, you cannot just add the AveragePreviousMonthSales field from the derive table, or SQL Server complains that it is not “contained in either an aggregate function or the GROUP BY clause.” To allow the result to be used, you have to wrap it in the MAX() function. Once the result is handled like this, it can appear in the query output. The MAX() function does not alter the result of the AveragePreviousMonthSales field in any way since it is already aggregated and correct. The function merely allows the result to be used in the outer aggregate query.
Using derived tables in subqueries is a standard technique for comparing data over time in SQL. Figure 2 explains this concept more visually.
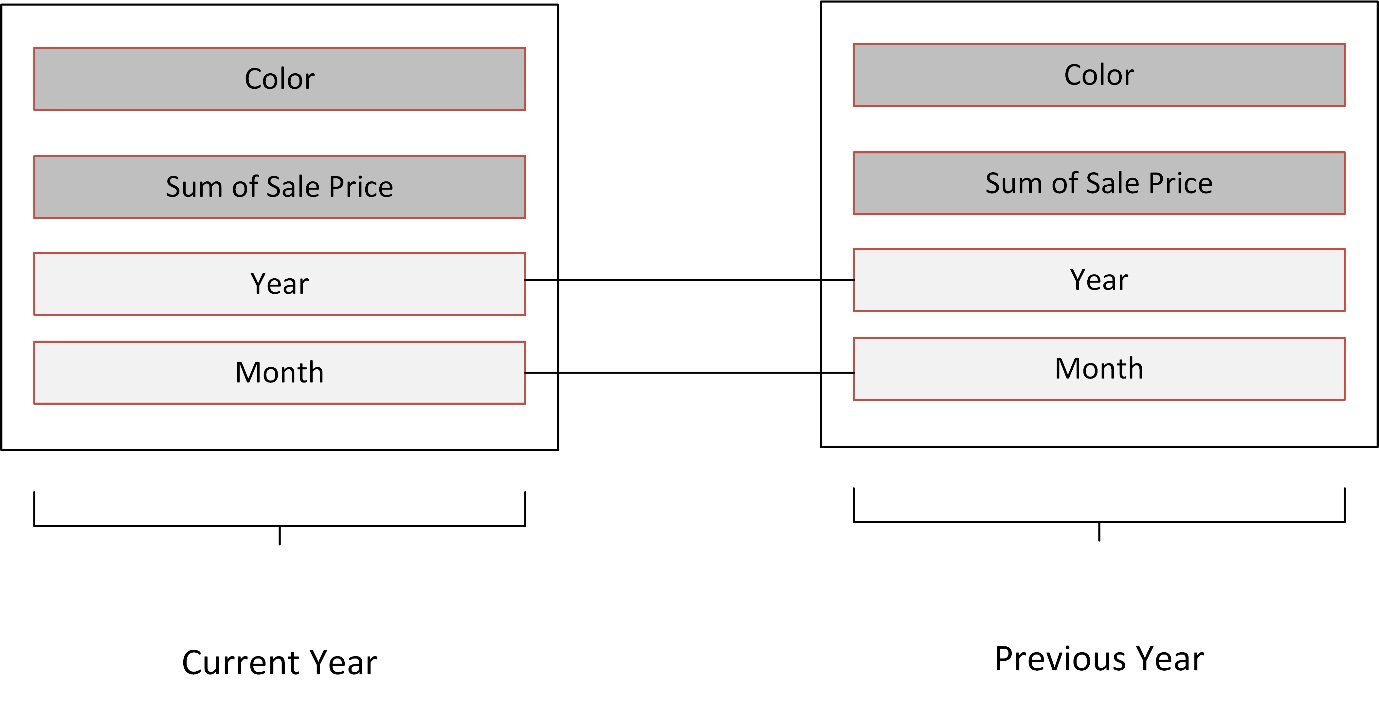
Figure 2. Comparing data over time using a derived table
Tricks and Traps
To extend your SQL knowledge, you might like to note this technique. As an alternative way to having the derived table return only the data for the previous year, you can use the DATEADD() function, like this:
WHERE YEAR(SA.SaleDate) = YEAR(DATEADD(yy, GETDATE(), - 1))
Of course, you need to understand the PrestigeCars database if you are going to comprehend this code – especially the FROM/JOIN clauses. To make your life easier, here is the ERD (Entity Relationship Diagram) for this database:

Figure 3: The Prestige Cars database Entity Relationship Diagram
That is it – you have seen a simple example of how to use a derived table to compare data with values from a previous year. Keep watching SQL Server Central.com ready for the next article in this series.
This article is adapted from the book “Query Answers with SQL Server Volume II: In-Depth Querying” by Adam and Karine Aspin. Available as both a paperback and an eBook from all good resellers including Amazon, Kobo and iBooks, as well as all good bookstores.

The sample data is available either in the accompanying material for this article, or on the Tetras Publishing website at: www.tetraspublishing.com/sqlserver.
The Series
There are a number of articles in this series. You can see them all on the Query Answers page.