

Trying to get past the Microsoft SQL Server Reporting Services learning curve?
Well never fret, this article is a first in a series of tutorials to walk you
through creating a practical report for your company to monitor your SQL
Server’s databases. In this sample report, we’re going to create a job
monitoring system. Specifically, we’re going to connect to our SQL Server and
report if the jobs succeeded or failed the last time they ran.
Easy enough right? This article assumes you already have Reporting Services
installed on the servers and the client installed on your side. If you haven’t
installed these components yet, please go out to this link and download and
install the client and server.
http://www.microsoft.com/sql/reporting/productinfo/trial.asp#download.
For your development PC, you should only have to install the client component
unless it is also acting as your server. Also for the purpose of this report,
we’re going to steal a query written by another SQLServerCentral.com member and
can be downloaded in clear text here:
http://www.sqlservercentral.com/scripts/contributions/916.asp.
With the installation complete and the housekeeping complete, let’s open up
Visual Studio and begin designing our report. Visual Studio 2003 will act as my
design interface.
- Open Visual Studio and go to File | New | Project
- Select Business Intelligence Projects under the Project Types box. If you do
not see this project type, then the Reporting Services client is not installed
on your machine. Once you’ve selected Business Intelligence Projects, click
Report Project Wizard. Then, type the name of the project. For the purpose of
this example, I typed SQLMonitor as my project data. Click OK once you have
those steps completed.
- In the Select Data Source screen, type a logical name for the connection you’re
going to make in the Name field under New Data Source. I named mine msdb. You
may also see the Shared Data Source drop-down box populated if you have created
one in the past. Next, click Edit to set the connection properties. I’m
connecting to a server called REPORTS and connecting to the msdb database.
Alter enter your login credentials and whether you’d like to connect with
Windows or SQL authentication. You can also specify that you’d like the user to
be prompted for login credentials when viewing the report under the Credentials
area. I also checked Make this a Shared Data Source. This means other
reports that we create later will be able to use this same connection
information. It’s important to note here that this connection may or may not be
your reporting services server. Instead, this is the SQL Server who’s jobs
you’d like to monitor. After entering my data, the Connection String looked
like this:
data
source=REPORTS;initial catalog=msdb
- The next screen allows you to enter the query manually that you’d like to run
against the data source. My query was taken from the earlier mentioned script
by one of our users but I have modified it so we’re prepared for another part
in this article series. So, please use this script in the Query String text box
instead of the one in the link:
select distinct j.Name as "Job Name",j.enabled, j.category_id, j.description as
"Job Description", h.run_date as LastStatusDate, case h.run_status
when 0 then 'Failed'
when 1 then 'Successful'
when 3 then 'Cancelled'
when 4 then 'In Progress'
end as JobStatus
from sysJobHistory h, sysJobs j
where j.job_id = h.job_id and h.run_date =
(select max(hi.run_date) from sysJobHistory hi where h.job_id = hi.job_id)
order by j.Name
- Notice that you can also click the Edit button to write the query in a GUI
design fashion. Fancy and familiar interface for those like me who hate writing
queries!
- By clicking the Next button, you will be taken to the Report Type screen. For
most reports including this one, you’ll want to do a Tabular report and click
Next.
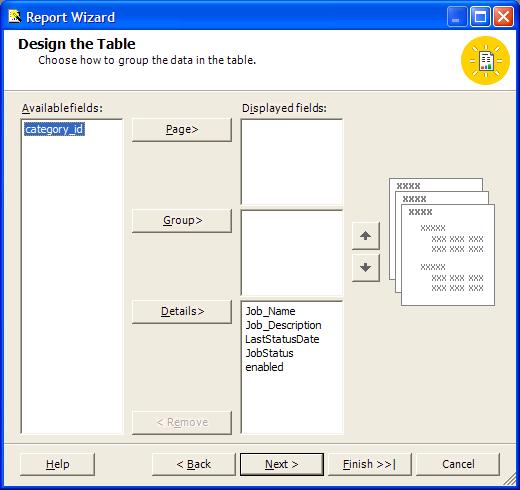
- You must then design the table by highlighting the SQL Server column that you’d
like in the page, group or details and select the corresponding button as shown
in the below screenshot. The Page selection will create a new page any time
that the column’s row changes. The Group selection will group the data by that
column. The Details selection is the column that we’re concerned with and we
want to use all the columns except for the CategoryID column as shown
below.

- Once you click Next, you’ll be taken to the Table Style screen in the wizard,
which may look vary familiar to many of you. Later, I’ll show you how you can
modify the templates that are presented here to reflect your corporate style.
For the time being though, let’s just select the Casual template.
- Next, choose you’re deployment server. This is the SQL Server Reporting
Services server that you’re going to send the reports to after they’re
complete. This can be altered later once you’re ready to deploy to a different
environment or server. The default is http://localhost/ReportServer so all
you’ll have to do is change the localhost entry to your server name. Mine is
http://REPORTS/ReportServer. You can also specify here what folder you’d like
Visual Studio to create once you deploy your reports. A report helps you
subdivide the tons of reports you may have and secure them at different levels.
My folder name is SQLMonitor.
- After clicking next, the last screen is the confirmation screen, where you type
the report name. Spaces are allowed if you’d like. I called mine Job Monitor
and clicked Finish.
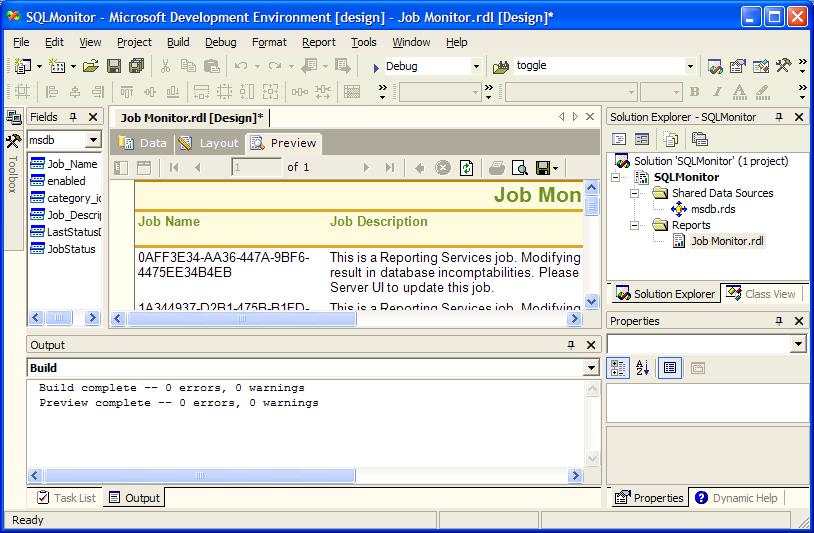
Congratulations, you’ve finished your first report. Well, almost. Let’s explore
some of the features now that you have your report essentially complete. If you
haven’t already done so, click on the Preview tab above to view the report. The
report is a pretty useful report for administrators but it’s very unattractive.
As you can see the columns need widening and the Enabled column is pretty
useless in its Boolean form for a novice user.
First let’s widen the first two columns, deploy the solution and then call it a
day. To do this, go back to the Layout tab in Visual Studio. To adjust column
width, select the column’s header you’d like to widen by left-clicking. You’ll
then notice an extra row with no data will be presented to you above the
column. Left-click and hold between the two columns and drag them to the
appropriate size, much like you do in Excel or SQL Server. An alternate way is
to select the column then change the column width in the Properties pane on the
right of the design interface. Click the preview again and see your progress.
It may take a few hundred times before you have configured it to the perfect
width for your viewers. You may also want to adjust the report header width as
well to make it look nicer. Here’s a sample of what my report looks like in
Preview mode. I’ve shrunken it down a bit so it would fit in HTML cleanly.
Now that your report is ready for
primetime, you can deploy it to the development server for others to view it.
To do this, click Deploy Solution or Deploy SQLMonitor (if you only want to
deploy the individual report project) under the Build menu in Visual Studio.
With your report deployed, users can now go to Internet Explorer (if they have
permission to) and go to your deployment directory to view the report. There
are other methods to view the report as well. Primarily, users could view it
through your application or through a web service. Here’s how mine looks:
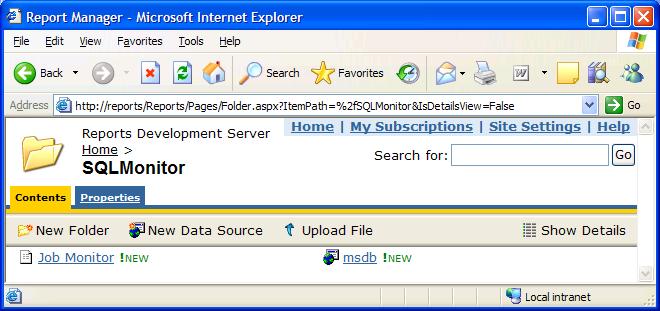
You probably don’t want users
seeing the msdb data source in the default view. To remove that, you can click
on the msdb data shared data source and check Hide in List View.
In future articles in this tutorial series, we’ll explore bite-sized chucks of
Reporting Services. From administrating the server to more complex design
components. Please save the report you’ve just created though! We’ll use it in
each part of this series as we progressively become more complex.
