

Introduction
When T-SQL code is run, information about which indexes it uses and how it uses them (i.e. updates, seeks, scans, lookups) is stored. Additionally information about the number of rows affected by the running code is also recorded. Using this information, we can target our performance improvements to those specific indexes, leading to better performing code.
The purpose of the utility described in this article is to identify the names and type of usage of indexes used by a given piece of T-SQL (a stored procedure or a batch of SQL statements), and then suggest ways in which these targeted indexes can be improved.
Indexes are one of the main tools for improving T-SQL performance. However information associated with indexes can become stale over time. Such information includes statistics, degree of logical fragmentation, and the fill factor. We will discuss how these can be improved later, but first we need to create the utility to identify which indexes are used by a given piece of T-SQL code.
This utility makes use of Dynamic Management Views (DMVs), so can be used by SQL Server 2005 or higher.
dba_ShowIndexUsage Utility
The T-SQL code used to create the utility dba_ShowIndexUsage is given in Listing 1.
The routine expects a single parameter (@SQLToRun), this is the T-SQL for which you want to obtain index usage information. There is an optional parameter (@Debug) that displays debug information, by default this is set to off.
The utility takes a snapshot of the current state of the various index usage counters, runs the relevant piece of T-SQL code for which we want index usage details, then takes another snapshot and finally compares the two snapshots to identify index usage.
Since the T-SQL code passed to the utility actually runs, it might be worthwhile wrapping the call to the utility in a rolled-back transaction if you do not want the updates to be applied. This will not affect the index usage counters since they are independent of any transaction i.e. a rolled-back transaction still updates the index usage counters.
Taking a snapshot of the various index usage counters involves the DMV sys.dm_db_index_usage_stats joined to the catalogue view sys.indexes. Note a right outer join is used because if the index hasn’t already been used (since SQL Server was last restarted etc), it will not have an entry in the DMV. Additionally a join is made between sys.indexes and sys.sysindexes, between sys.indexes and sys.tables, and finally between sys.tables and sys.schemas.
The DMV sys.dm_db_index_usage_stats provides details of various ‘bulk’ index usages (i.e. the number of SQL statements that performed updates, seeks, scans, lookups). The catalogue view sys.sysindexes, provides details of the number of rows affected, the other views provide descriptive information.
The utility selects relevant fields from the above views. The selected fields are described in figure 1 (largely taken from SQL Server 2008 Books online).
| Column name | Data type | Description |
| DatabaseName | nvarchar(128) | Name of database. |
| SchemaName | sysname | Name of schema. |
| TableName | sysname | Name of table. |
| IndexName | sysname | Name of index. |
| IndexType | varchar | Type of index (Clustered, Non-clustered, Heap) |
| User Updates | bigint | Number of update SQL Statements i.e. inserts, deletes, updates. |
| User Seeks | bigint | Number of seeks by user queries. |
| User Scans | bigint | Number of scans by user queries. |
| User Lookups | bigint | Number of bookmark lookups by user queries. |
| Rows Inserted | bigint | Rows inserted (since the last time the statistics were updated). |
| Updates I/U/D | int | Counts the total number of inserted, deleted, or updated rows (since the last time the statistics were updated). |
Figure 1 Columns in the dba_ShowIndexUsage utility.
Note the User column usage counts relate to the number of times the index was accessed by the running T-SQL code (i.e. the code passed as a parameter to the utility), not the number of rows within the index that were accessed.
As an example, if a T-SQL statement updates 10 records (that are part of an index), it will have a ‘User Updates’ value of 1 (i.e. one update statement has been run), and will have an ‘Update I/U/D’ value of 10 (i.e. number of rows inserted, updated, or deleted), if the column updated is the leading column of the index. The ‘Rows Inserted’ will have a value of 0 since the number of records has not changed.
Depending on how the query uses the index it updates the relevant usage counters. A seek is a keyed access and is typically most efficient method of retrieving a small number of selective rows of data. A scan occurs when an index is examined to retrieve a range of rows. A lookup occurs when this index is used to lookup data in another index.
The WHERE clause ensures only non-system indexes in the current database are examined. The results are sorted by schema name, table name and then index name.
To determine which indexes are used by a stored procedure called ‘dbo.ProcessIWS’, you run the following command:
EXEC dbo.dba_ShowIndexUsage @SQLToRun = 'dbo.ProcessIWS'
Running the utility on my SQL Server, gives the results shown in Figure 2.
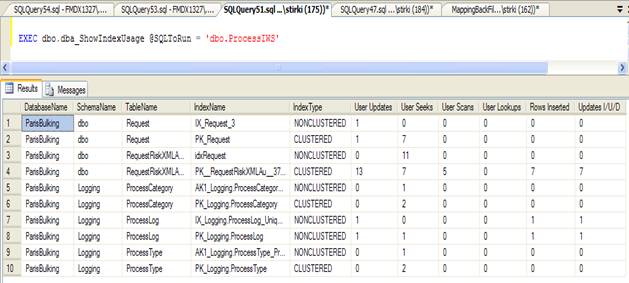
Figure 2 Output from running the dbo.dba_ShowIndexUsage utility.
The results show that when the stored procedure is run, 10 specific indexes are accessed, details of how they are accessed is also shown.
Discussion
This utility allows you to determine which indexes are used, how they are used, and the number of row affected, when a given stored procedure or batch of T-SQL code is run. This information can be useful in targeting improvements to your T-SQL with a view to improving its performance.
Each index has a statistics object associated with it. This object includes information about the distribution and density of the index’s columns. For large tables updating these statistics can be time consuming, so a smaller sample of rows is typically taken. If we know the specific indexes involved with a query, we can provide a greater sampling size and thus a better representation of the data, in the same amount of time, compared with a blanket statistics update for the table as a whole.
Large tables have an additional problem concerning statistics. Typically a table’s statistics are only updated (automatically) when 20% of its rows change. For large tables this means their statistics can be stale for quite a while before they are updated. Using the above targeted method of improvement should help ensure the relevant statistics are kept up to date, and this should help improve query performance.
Logical index fragmentation indicates the percentage of entries in the index that are out of sequence. This is not the same as the page-fullness type of fragmentation. Logical fragmentation has an impact on any order scans that use an index. Where possible, this fragmentation should be removed. This can be achieved by rebuilding or reorganizing the index. The degree of fragmentation can be seen by examining the DMV sys.dm_db_index_physical_stats. Typically if an index has over 30% fragmentation a rebuild is recommended, if it is between 10% and 30% a reorganisation in recommended.
It is also advisable to ensure the degree of physical fragmentation is not excessive, since the page splits this will result in great IO with a corresponding decrease in performance.
Fill factor describes the number of entries on the page, for an index that is mostly read-only we would want the page to be relatively full, so we can get more data per read. Whereas for an index that has many update/inserts we would prefer a less full page to prevent fragmentation that could hurt performance. We can use the output from this utility to determine if an index has mostly read access or not, and set the fill factor accordingly.
The type of index access can provide us with some interesting information. A large number of User Lookups could indicate additional columns should be added to the index via the INCLUDE keyword since the index is being used to get data from the underlying page. User Scans sometimes are indicative of a missing index, inspecting the underlying T-SQL code will show if a scan was intended or if a more appropriate index needs to be created.
Indexes can cause updates to run more slowly, since the updates may need to be applied to both the table and its indexes, this can have a significant impact when a large number of updates are made. If the indexes have many updates (see the ‘User Updates’ column in the output) but few or no reads (see the other User columns), you can investigate if you would get better performance by removing the index. In some cases it may be advisable to disable the index during updating and then enable it afterwards. In essence, you should consider the combined total T-SQL code that runs on the underlying tables before you consider adding or removing indexes.
If you know that certain indexes are used more than others, you might want to put them on different physical disks, this should give better concurrent access and improved data retrieval times. This is particularly relevant to indexes that are used repeatedly to join the same tables.
Note if the table is relatively small, none of its indexes might be used, this is because it is cheaper for the optimiser to get the data directly via the table rather than an index.
This utility can also be used to confirm that certain indexes are not being used by a SQL query. Investigating why an index is not being used might result in the T-SQL being rewritten or changing the index definition or even the deletion of an unnecessary index.
It may be worthwhile running the Database Tuning Advisor on the T-SQL code to ensure the indexes you have are still appropriate or if additional ones should be added. Additionally various missing index DMVs (names starting with sys.dm_db_missing_index_) can be useful in tracking down missing indexes.
Sometimes the values in ‘Rows Inserted’ and ‘Updates I/U/D’ columns may not match what you might expect in the other ‘User’ columns. This can have various causes including:
- For the ‘Updates I/U/D’ column to be updated, the T-SQL code must change an entry in an index where the leading column is updated
- The combined affect of updates/deletes/inserts need to be considered
- If statistics are updated when the utility is run, the ‘Rows Inserted’ and ‘Updates I/U/D’ columns get reset (sometimes leading to a negative value).
- Although an update statement may run (so it shows up in the ‘User Updates’ column), it may not actually update any rows of data (so it does not show up in the ‘Updates I/U/D’ column).
- A rolled-back transactions seems to affect the ‘Rows Inserted’ and ‘Updates I/U/D’ columns, whereas a committed transaction may not
It might be advisable to run the T-SQL code under investigation twice since if the indexes haven’t been loaded before they will give a NULL value in the ‘Rows Inserted’ and ‘Updates I/U/D’ columns.
A potential caveat of the method described in this article is it does not limit the index changes to only the T-SQL code under investigation i.e. if any other code is running concurrently on the same database, its index accesses will also be recorded. Some ways around this problem include: running the T-SQL code on a stand-alone database, or at a time when you know nothing else is running. That said, this caveat can be turned into an advantage since we may want to know about all index access on a given database.
Further work
It should be possible to use the output from this utility as input to a routine that would automatically generate and run the code involved in index reorganisations, index rebuilds, statistics updates etc.
Currently, for convenience, the utility sorts the results by schema name, table name and index name. It might be better to sort the results by ‘User Updates’ if you’re interested in fill factor and fragmentation improvements. Similarly if you’re interested in the database statistics improvements, you might want to sort the results by the total combination of all the User columns for each index.
If you have a long running regular batch process (e.g. overnight calculations), it is possible to alter this utility so it logs the index changes at regular time intervals (an example of this is given in ‘Example Usage’ section of the code listing). Using this information, you can schedule statistics updates to the identified indexes to be run before their up-to-date data is access, giving better performance.
While this article does suggest ways to alleviate the problem, it would be nice to identify index usage that relates only to the T-SQL code we are running.
Conclusion
This utility allows you to determine what indexes are used, how they are used, and the number of rows involved, when a given stored procedure or batch of T-SQL code is run. Knowing this you can apply the targeted index improvements suggested in this article to improve the performance of your T-SQL code. This utility should prove valuable in the everyday work of the SQL Server DBA/developer.
Credits
 Ian Stirk has been working in IT as a developer, designer, and architect since 1987. He holds the following qualifications: M.Sc., MCSD.NET, MCDBA, and SCJP. He is a freelance consultant working with Microsoft technologies in London England. He can be contacted at Ian_Stirk@yahoo.com.
He is the author of SQL Server DMVs in Action: Better Queries with Dynamic Management Views.

