

This is the sixth article in a series that examines the output of the Brent Ozar Unlimited sp_Blitz™ script run against the SQLServerCentral database servers.
Managing a SQL Server is an ongoing job. While the SQL Server platform will run itself for a long time, as your workload evolves, your applications are patched, and your staff experiences changes, it's easy for configuration and security issues to creep into your environment. The best way to prevent issues and problems is with regular monitoring and auditing of your instances.
The SQLServerCentral servers are regularly monitored, using SQL Monitor from Red Gate Software, and you can see the data at monitor.red-gate.com. We expose that as a demonstration of what the monitoring software can do. This covers alerts and problems that occur in real time, but it doesn't catch some changes which may occur over time.
This is where some type of auditing becomes very important. One of the ways in which you might think about auditing your instances is with a standard script that examines various potential places where your configuration isn't optimal.
sp_Blitz™

Brent Ozar Unlimited has released a fantastic script for examining the configuration, health, and performance of your SQL Server instances. This script is known as sp_Blitz™ and is currently at v16. You can download it and it builds a stored procedure that you can run on any of your instances.
A tremendous amount of information is returned. If you are interested, you can read about the script on the Brent Ozar Unlimited site.
We used this script to perform a quick audit of our database server instances in December of 2012 and learned a few things. This series of articles examines the results and mitigation strategies we've taken. The other articles are:
- Security
- Reliability
- Performance - Part 1
- Performance - Part 2
- Query Plans
- Informational and other lower priority items
For this article, we updated the sp_Blitz script to v22, since it had been quite some time since we had run it. This article examines those items related to the reliability captured by your database server.
Informational and other lower priority items
The next Findings Group output by the sp_Blitz script is the Backup section. However there are a number of relatively small number of other groups that we are including in this article:
- Backup
- Global Trace Flag
- High Availability
- Informational
- Non-Default Server Config
- Reliability (lower priority)
- Security (lower priority)
- Server Info
- Thanks
These are more informational items, and we are grouping them together for discussion, though these are more notifications than actual issues with the configuration. In these groups, we have the following items to discuss.
- MSDB Backup History Not Purged
- TraceFlag On
- Cluster Node
- Linked Server Configured
- Tables in the MSDB Database
- Agent XPs
- CLR Enabled
- Cost Threshhold for Parallelism
- Database Mail XPs
- Fill Factor (%)
- Max server memory
- Min server memory
- optimize for ad hoc workloads
- remote admin connections
- show advanced options
- Old Compatability Level
- Database collation mismatch
- Thanks from Brent Ozar Unlimited
Each of these items is discussed below with regard to our database server and the effects it has, and the mitigation performed.
MSDB Backup History Not Purged
This is one of those areas that can cause you a problem you never expect, at a time you aren't thinking about it. We often install SQL Server on the default C: drive, and while we may move data files, log files, and backups to other drives, we sometimes ignore the system databases, and don't manage them well.
We aren't overly worried about this as we have SQL Monitor running against these databases. If we run low on disk space, or we see msdb growing quickly, we can respond. We have alerts set up, which will notify administrators of potential issues.
In looking at trending for msdb, you can see that it hasn't changed in ahwile.
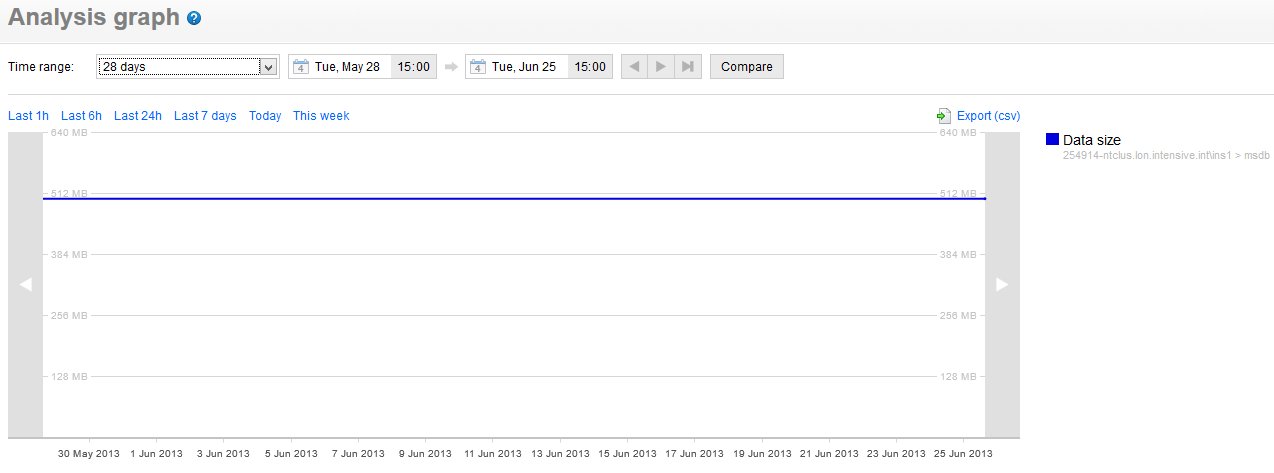
In fact, if I look at the entire year, there was one data growth in March that added a dozen MB to the database. If I examine the purge settings for MSDB history, I find that they are set for. This is acceptable for our environment, mainly because it's very slow growing.
With SQL Monitor in place, this isn't something we worry about on our servers.
You can read more about this alert at BrentOzar.com.
Trace Flags
Trace flags can be used to enable a wide variety of features or expose more information in SQL Server. However since these are non-standard options, you want to be aware of how the behavior of your instance has changed.
We have two trace flags enabled:
- 1204
- 845
These two flags are enabled for specific reasons on our system. Trace Flag 1204 is for returning more information on deadlocks. Because we have integrated with some third party software, we have had some issues with deadlocks. This is on our list for the developers to track down, and this trace flag was added to allow them to get more information on what caused the deadlock.
The 845 traceflag enables lock pages in memory. This was introduced for 64-bit standard editions of SQL Server. We have it enabled to allow the service account to manage memory better.
You can read more about this alert at BrentOzar.com.
Cluster Node
When examining a new server, many administrators want to know if any high availability or disaster recovery features are enabled. The sp_Blitz script alerts you to such items.
In this case, this instance is part of an active/active cluster. We are aware of this, and there is nothing to change based on this item.

You can read more about this alert at BrentOzar.com.
Linked Server Configured
Linked Servers are very handy for moving data between instances. However they can also be potential security holes or places where poor performance occurs. Knowing linked servers exist can be an important piece of knowledge when adminstering an instance.
In this case, we have three linked servers set. Both of these are for other databases on this instance. They were set up as we considered separating them out at one point to other instances, and to prevent any code issues, we used these linked servers in development. We won't be changing code here, especially as we may still use them at a future point in time.
You can read more about this alert at BrentOzar.com.
Tables in the MSDB Database
In general, you don't want to put any tables or data in the system databases, especially master and msdb. You may not restore these in a DR situation, and you might find your system not working if it depends on there being tables in system databases.
In this case, the item is being returned as there are a number of DTA_xxxx tables in msdb. These are tuning tables from an execution of the Database Tuning Advisor. These tables are out of date and can be deleted. I've sent a note asking these tables be removed from our system.
You can read more about this alert at BrentOzar.com.
Non-Default Server Config
There are a number of items changed on our server in terms of the configuration. It's good to know what's different, especially in a DR situation. In this case I need to track these items and be sure both sides of the cluster as set identically. However I wanted to discuss these settings:
Agent XPs - This is set to 1, I believe because of our use of SQL Backup Pro extended stored procedures for our backups.
CLR Enabled - The CLR is enabled on this server. I don't know of any assemblies, and I suspect this was either enabled for something on the other node, which runs Simple Talk, or it's a mistake.
Cost Threshhold for Parallelism - This setting tries to limit the amount of parallelism by setting a threshhold for when SQL Server will look to move to a parallel plan instead of a serial one. We have this set to 35 seconds, from the default of 5. I haven't determined why this setting is this high, but I am hoping someone tested this and didn't just arbitrarily pick a value.
Update: A comment from Brent Ozar noted this isn't a seconds setting, but a combination of CPU and IO cost. To date we don't have performance issues, so we'll still leave this alone.
Database Mail XPs - These are enabled since we send mail.
fill factor (%) - I'm not sure why this is changed, but moving from the default of 0 (100%) to 90 doesn't seem too bad to me. I'll live this one alone.
max (and min) server memory - It's always good to have these set. We have the max set to 20480 (20GB) and the min at 6144 (6GB). No need to change these from their current values at this time.
optimize for ad hoc workloads - We have way too many queries submitted to the server for my liking (as opposed to stored proc calls). However, since we do, and I can't change that, this is a good setting to enable.
remote admin connections - We host outside of our data center, on another network. We need this enabled.
show advanced options - Enabled becase we use advanced options.
You can read more about this alert at BrentOzar.com.
Old Compatibility Level
For the most part, you want all your databases set at the same level as the server. In our case this would be v10, but for some reason we have one database set as 90. It's not a SQLServerCentral database, so I'm not worried about it.
You can read more about this alert at BrentOzar.com.
Database Collation Mismatch
To prevent collation errors, typically administrators set all their databases to the default server collation. However we have two databases that were created and installed with third party software. These use the SQL collation (shown here from monitor.red-gate.com):
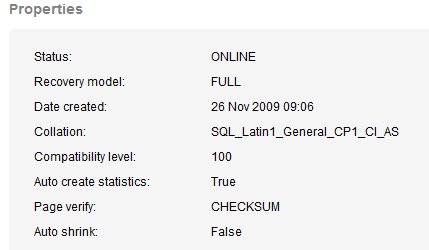
As you can see, this differs from the instance default:
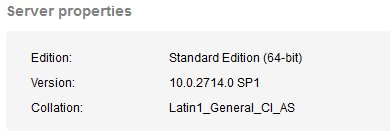
This hasn't cause errors to date, but I'm sure it will at some point. I can't change this, and don't have the developer time to worry about it for now. Fingers crossed this doesn't cause issues.
You can read more about this alert at BrentOzar.com.
Thanks
Nice to see Brent Ozar Unlimited thanking people for using the script. It's a great tool, and you should take a look at it.
If you want the script, you can get it at BrentOzar.com.
Moving Forward
This is the sixth article looking at the very helpful and popular sp_Blitz™ script, and it examined the query plans section of the output. The next article will look at how we've adapted this script to be a custom metric for our monitoring solution.
The other articles in this series are:
- Security
- Reliability
- Performance - Part 1
- Performance - Part 2
- Query Plans
- Informational and other lower priority items
This is a great script to run on your instances, but you need to run it periodically to catch changes, some of which might potentially be causing you problems, or will cause you problems in the future. Saving your output from previous runs and comparing the results and looking for changes is a good idea to save during future analysis.