Introduction
SQL Server Performance dashboard reports can be a handy tool for any database professional that requires monitoring or analysis of their SQL environment. However, one problem I find with these is that you must be actively connected to the server in question in order to see these dashboards. This article will show you how you can have a SQL Server Management Studio (SSMS) based performance dashboard driven off servers that are registered through a Central Management Server (CMS) and presented to you via SQL Server Reporting Services (SSRS).
Pre-Reqs
I have tested this solution against SQL Server 2008(SP3), SQL Server 2008R2 (SP1 onwards), SQL Server 2012 (SP1 onwards) and SQL Server 2014 (SP1 onwards) using a mixture of express, standard and enterprise editions across 'earthed' SQL Servers and SQL Servers in Azure VMs.
- You will need a Server, which has SSRS installed.
- You will need access to a SQL Server where you have registered your servers that you want to monitor via CMS setup. (For my example I kept it simple and kept CMS on the same server as my SSRS server – but this may not apply to you)
- Download the Report Definition Files (RDLs) from http://www.microsoft.com/en-us/download/details.aspx?id=29063).
How It Works
For this example REPSQL01 is the server that has SSRS installed and CMS setup thus this will be where you will view your SQL Server reports from using the performance dashboards report definition files (RDLs)
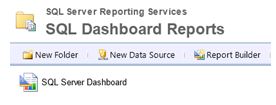
You then need to deploy the dashboard TSQL( that you should’ve downloaded) to EACH target server( My example uses SQL05-08) that you would like to be monitored – Please note this file is called setup.sql located @ Program Files\Microsoft SQL Server\110\Tools\Performance Dashboard . Next you deploy the RDLs (from the download) to your main SSRS server (Your version of REPSQL01). For help on deploying RDLs please see the following link: http://msdn.microsoft.com/en-us/library/ms159615(v=sql.120).aspx
This solution uses Windows Authentication so you will need to make sure that the login you are using to run the report has permission to the target servers and has permission to your CMS. Once permissions have been setup the results of the execution of the various stored procedures will render back to your Main SSRS server (REPSQL01).
Diagrammatic View
The diagram below shows you the high level view of my solution. As you can see I have my main report server (REPSQL01) that holds my dashboard reports. This interacts with the CMS to get my server list which then is used to connect to my SQL Server estate.
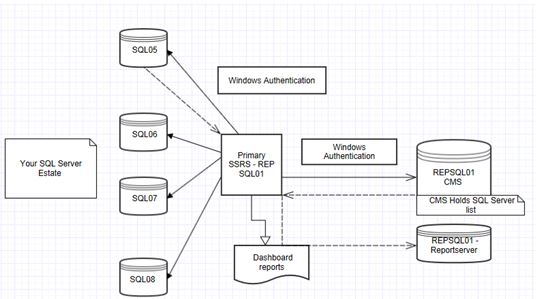
I’ll assume that you have a SSRS server ready and setup your CMS to hold your SQL Servers of interest. The key concept here is a shared dataset within your solution which defines your list of servers that you want to monitor (from CMS):
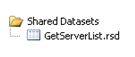
The T-SQL shown below is the code that defines the shared dataset:
USE msdb
GO
SELECT server_group_id,
server_id,
server_name
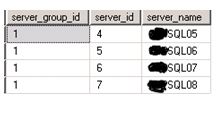
FROM dbo.sysmanagement_shared_registered_servers_internal
WHERE server_id BETWEEN 4 AND 7This query shows the servers I have registered on my CMS.
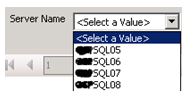
On a SSRS level (once deployed) the shared dataset will look like the image below:
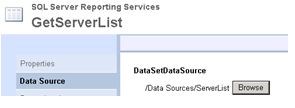
This will then become the parameter list for the main entrance page to connect to one of my servers (see later – in the results section).
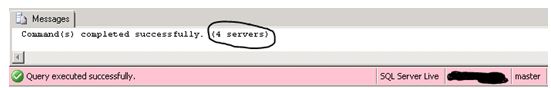
Just because we have setup the SQL Servers via CMS doesn’t mean it will work yet, you need to deploy the setup.sql script to EACH server that you want to monitor. A little tip here – If you have many servers that you would like to deploy the code to then you can use CMS to cut the deployment time down. For example I have a group within CMS called SQL Server Live, I then connect to the group and run the setup script once: For further details about CMS please see https:/technet.microsoft.com/en-us/library/bb934126(v=sql.110).aspx.
As you can see from the image below I connected to four servers and executed the script once.
Due to the fact that I am using Windows Integrated security model and that my account is sysadmin I have no issue running the reports or connecting to CMS. If you want to be more granular (using a non-sysadmin account) you will need to execute the code below on each target server using your relevant AD account.
USE msdb
GO
GRANT EXECUTE ON MS_PerfDashboard.usp_CheckDependencies TO [Domain\Account]
GRANT EXECUTE ON MS_PerfDashboard.usp_Main_GetCPUHistory TO [Domain\Account]
GRANT EXECUTE ON MS_PerfDashboard.fn_WaitTypeCategory TO [Domain\Account]
GRANT SELECT ON MS_PerfDashboard.fn_QueryTextFromHandle TO [Domain\Account]
GRANT EXECUTE ON MS_PerfDashboard.fn_hexstrtovarbin TO [Domain\Account]
GRANT EXECUTE ON MS_PerfDashboard.usp_Main_GetCPUHistory TO [Domain\Account]
GRANT EXECUTE ON MS_PerfDashboard.usp_Main_GetMiscInfo TO [Domain\Account]
GRANT EXECUTE ON MS_PerfDashboard.usp_Main_GetSessionInfo TO [Domain\Account]
GRANT EXECUTE ON MS_PerfDashboard.usp_Main_GetRequestWaits TO [Domain\Account]
GRANT EXECUTE ON MS_PerfDashboard.usp_GetPageDetails TO [Domain\Account]
GRANT EXECUTE ON MS_PerfDashboard.usp_GetPlanGuideDetails to [Domain\Account]
GRANT EXECUTE ON MS_PerfDashboard.usp_TransformShowplanXMLToTable TO [Domain\Account]

USE master
GO
GRANT VIEW SERVER STATE TO [Domain\Account];
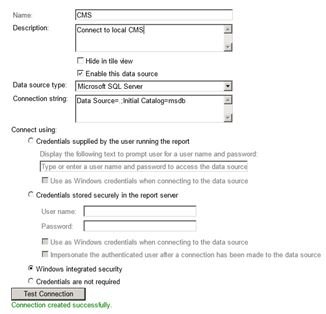
Finally you need to setup the CMS data source on your SSRS server as shown below.
Steps Completed
So at this stage you should have completed the following:
- Setup your target servers via CMS.
- Deployed the TSQL dashboard code to each target server.
- Ensure that the account running the reports has access to the target servers and to CMS.
- Deploy the dashboard RDLs to your report server.
- Setup a data source on SSRS to link to CMS.
Everything is now ready for communication.
Results
Let's look at selecting server SQL06 as the example.If you connect to the main dashboard page, you will see this.
Clicking the above report gives you:
Once you have selected a server you will get the main page for the server, as shown below:
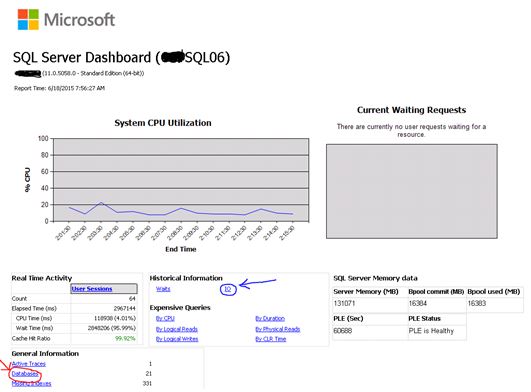
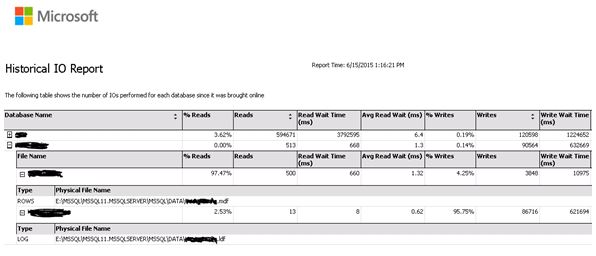
Links to further reports are possible because under the covers SSRS passes the server name into the next connecting report. (See the additional screen shots). If you click the IO link as shown via the blue circle / arrow it will give you general IO information as shown below.
The linking is done by creating a parameter in every report and calling this parameter within each data source's connection string as an expression, such as: ="Data Source=" & Parameters!ServerName.Value & ";Initial Catalog=master".
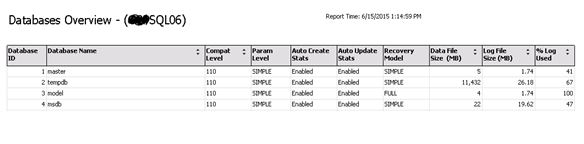
Clicking the database link shown via the red circle / arrow (as indicated on the main screen shot) will take you to a general database information page.
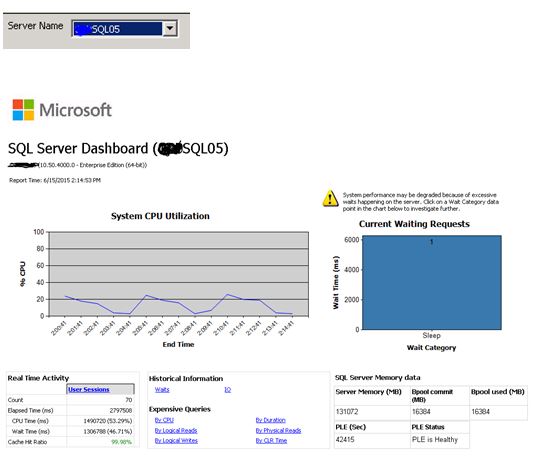
To navigate back to the home page to select a new server you could just click the MS logo located top left corner. You will be re-presented with the SQL server list. Alternatively you could use the browsers navigation buttons to view previously generated reports. The below screen shot shows me selecting SQL05 from the main home page.
Wrap-up
Hope this gives you some insight regarding how to centralise your dashboard reports via SSRS and CMS. The great thing here is that you have the ability to modify/ develop the reports to your needs - for example I changed the CPU graph from bars to lines and even added a memory section. There are no limits to customisation here. For my next version, I intend to include a security audit section.
Please note that when using the query plan RDL for SQL Server 2012 SP1 you may get the following known issue if you pass an XML parameter above a certain size:
If this concept really interests you then please visit CodePlex using this link http://sqldashboards.codeplex.com/ where I have made my solution avaliable to the community. Hopefully it will save you setup time and I hope that you will make use of it.
Thank you to Wayne Sheffield for reviewing this article and thank you to Paul Randal for the past 5 month’s worth of encouragement.