

Performance Monitor (PerfMon) is an inbuilt Windows Tool for monitoring all aspects of Windows and hosted applications such as SQL Server. Performance Metrics in PerfMon are referred to as counters. PerfMon counters can be visualized in real time. A Data Collector Set is used to organize and schedule performance counter data as a single collection to be analyzed later. When you install SQL Server, windows adds counters relevant to SQL Server in Perf Mon.
Back in the day when budget was low and not many people were interested in SQL Server (at least in my environment), we had to develop creative ways of taking care of those aspects of database management that are taken for granted these days. Monitoring and troubleshooting are critically important and several SQL Server specific tools for achieving this are out there - Redgate SQL Monitor, Devart dbForge Studio, SentryOne SQL Sentry etc. Today’s article describes how to use Windows Performance Monitor objects and counters to monitor SQL Server.
Windows Performance Monitor is a native windows tool that allows admins to monitor windows and applications running on windows. While it may not be the most efficient way to monitor your instances, you could find the approach useful when you want to investigate a specific issue leveraging the flexibility of performance counters. Think of it as something similar to using SQL Profiler or Extended Events which come built-in with SQL Server. SQL Server specific Performance Counters are viewable through a catalog view known as sys.dm_os_performance_counters within SQL Server. About 2336 rows are returned by the following query in SQL Server 2022:
SELECT * FROM sys.dm_os_performance_counters;
The instance level permission VIEW SERVER STATE is required to see the result set of this query.
How to Use Performance Monitor
Performance monitor can be used to display real-time information or collect performance data (Data Collector Sets). To view the the real-time statistics displayed by performance monitor take the following steps:
- Launch PerfMon by typing perfmon in the run menu
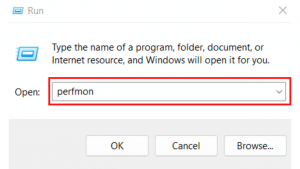 Fig. 1 Launch Perfmon on Windows
2. Select “Performance Monitor”
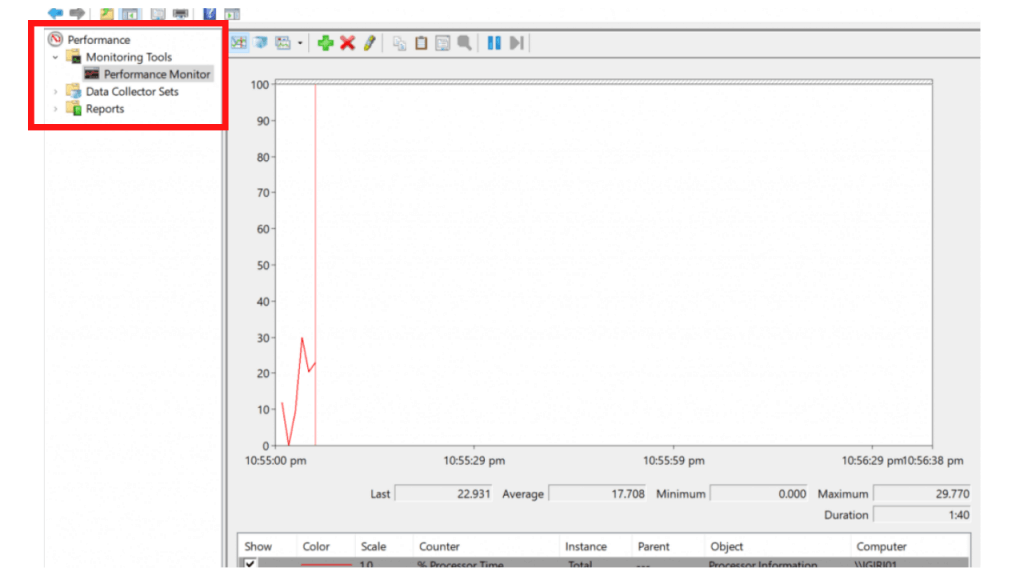 Fig. 2 Performance Counter Dashboard
3. Click the green plus sign to add counters
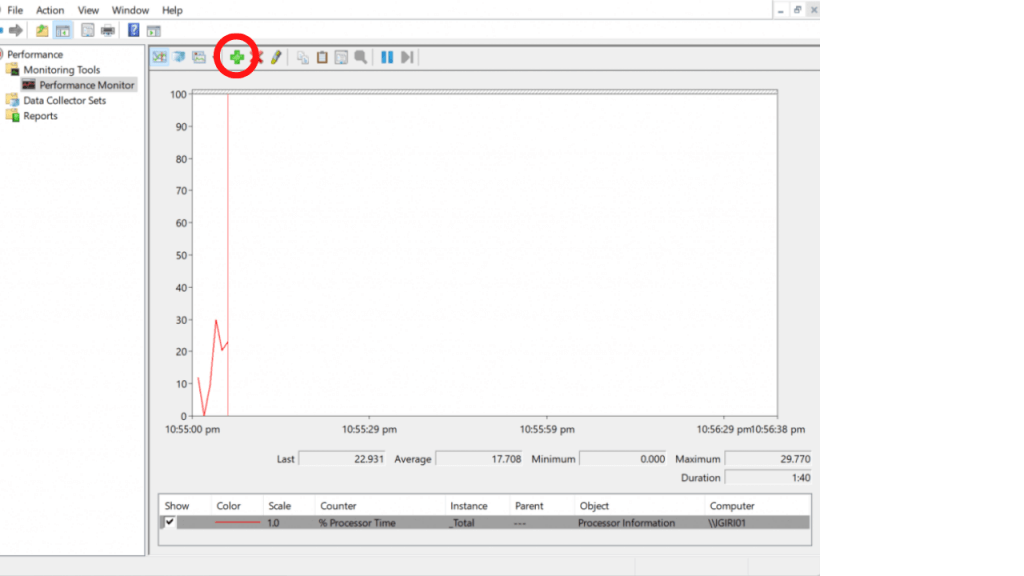 Fig. 3: Adding Counters on Performance Monitor
4. Scroll down to the desired performance object and expand it. Microsoft uses the prefix “SQL Server:” to identify performance objects related to SQL Server. Also notice you can learn more about each performance counter by clicking “show description” at the bottom of the window.
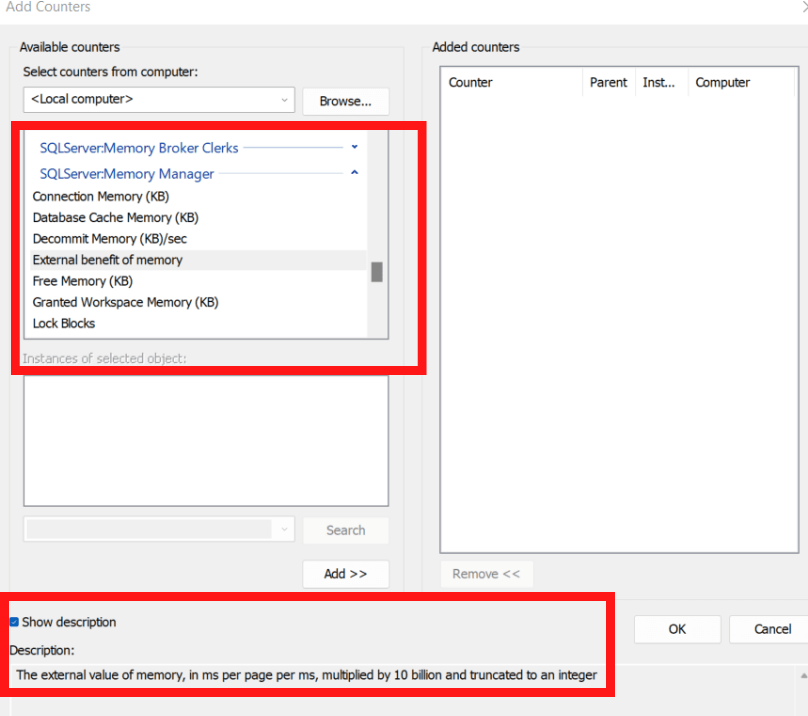 Fig. 4: Select SQL Server Performance Counters
5. Select the desired counters associated with the object and click the add button. The selected counters should show up in the right pane.
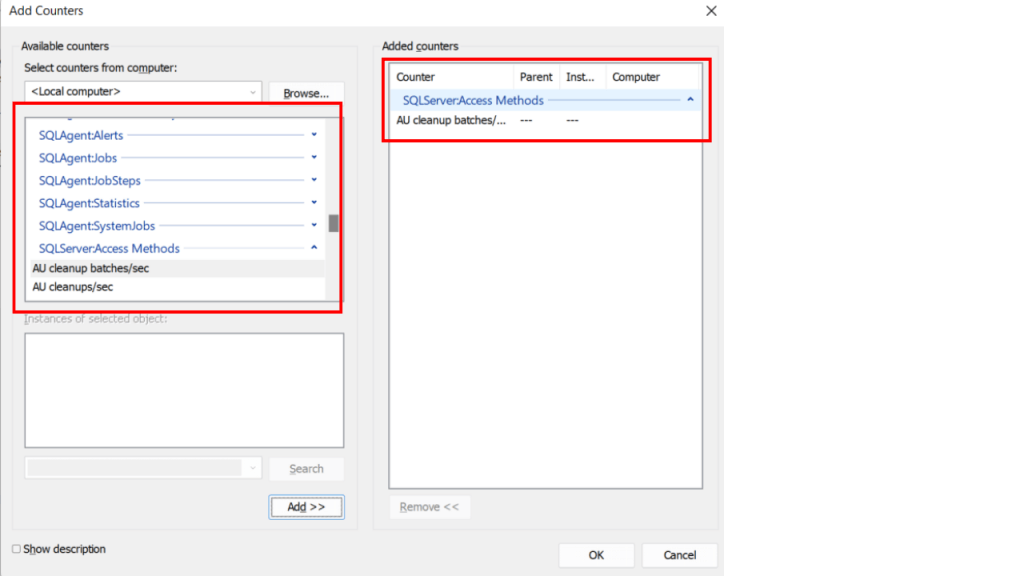 Fig. 5: Add Performance Counters to Dashboard
Adding counters in real time allows you visualize what is happening in the system in real time (see Fig. 6). This can be useful for troubleshooting an ongoing performance problem particularly if it is related to performance. Beyond this, it is also possible to capture performance information in a Data Collector Sets. This acts as a baseline and also allows the administrator to examine the state of the system from historical data before an issue occurs.
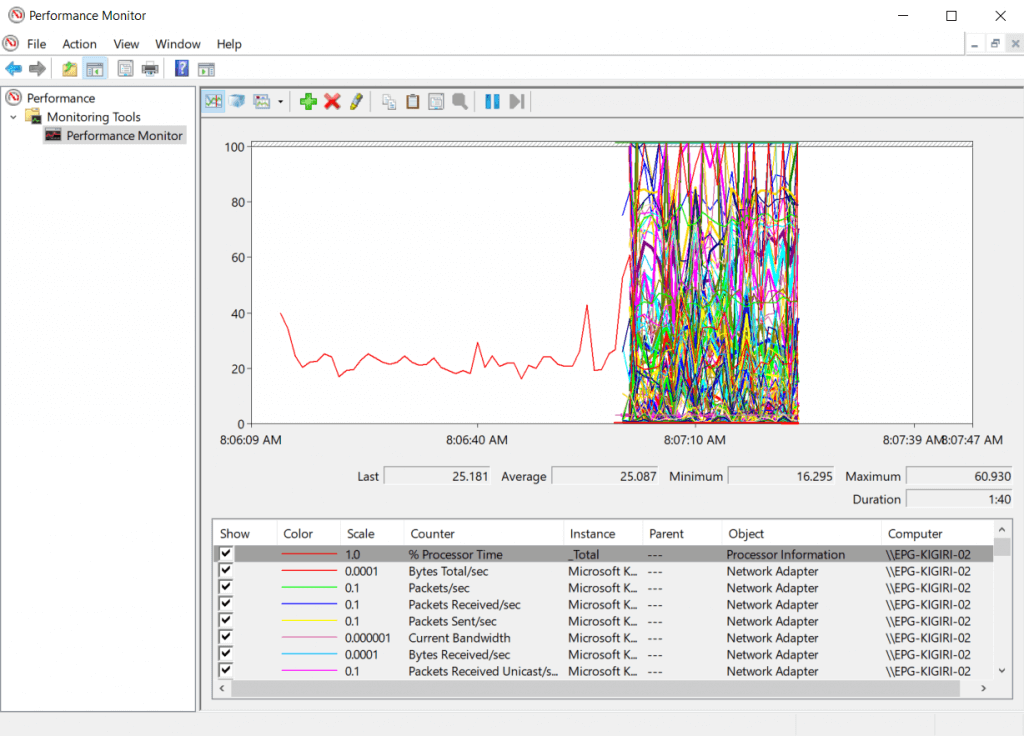 Fig. 6: View Performance Monitor Dashboard
Creating a Data Collection Set
From the performance monitor window, instead of viewing counters in real time, you can choose to create a data collector set (see Fig. 7).
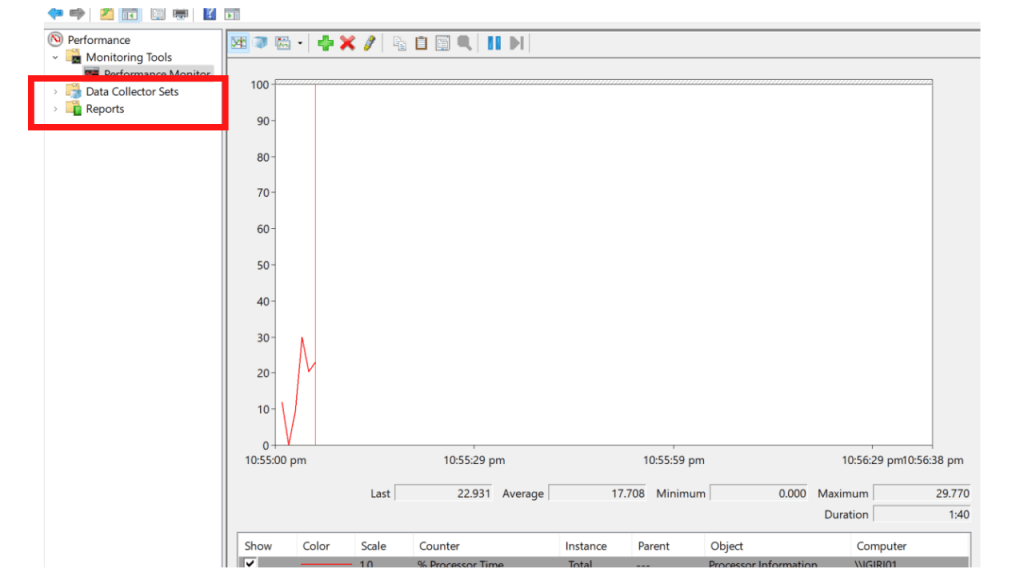 Fig. 7: Create Data Collector Set
The following screen shots show the required steps.
- In this example, I named the data collector set SQL Server DCS because the counters I will select will be those pertaining to SQL Server performance metrics. I have also opted to create the Data Collector Set (DCS) manually. This means I will choose counters explicitly rather than relying on a template.
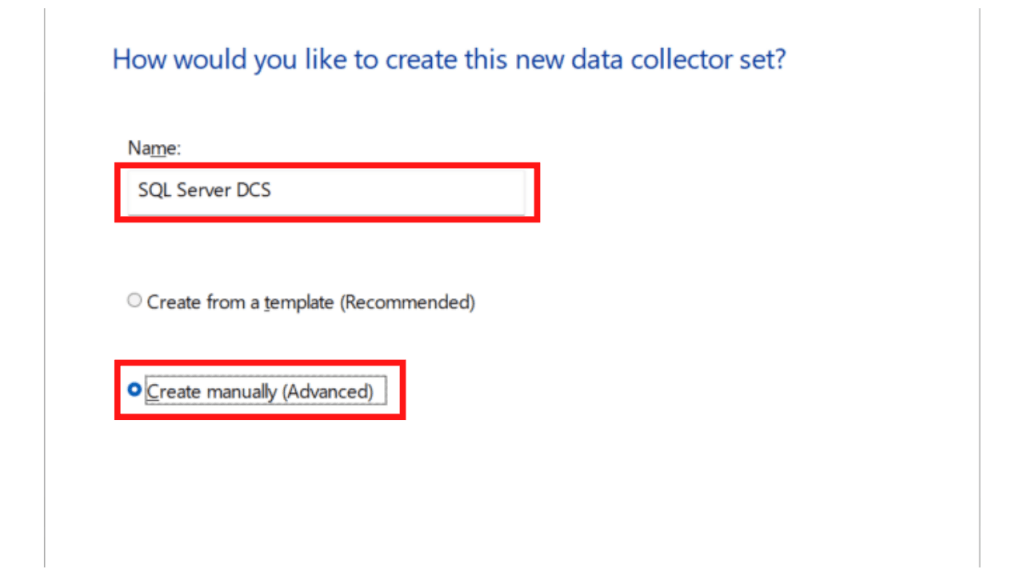 Fig. 8: Name the Data Collector Set
2. In step 2, I chose to include only performance counters in my DCS. This further establishes the fact that you can also use data collector sets for other purposes such as organizing event trace data or system configuration information.
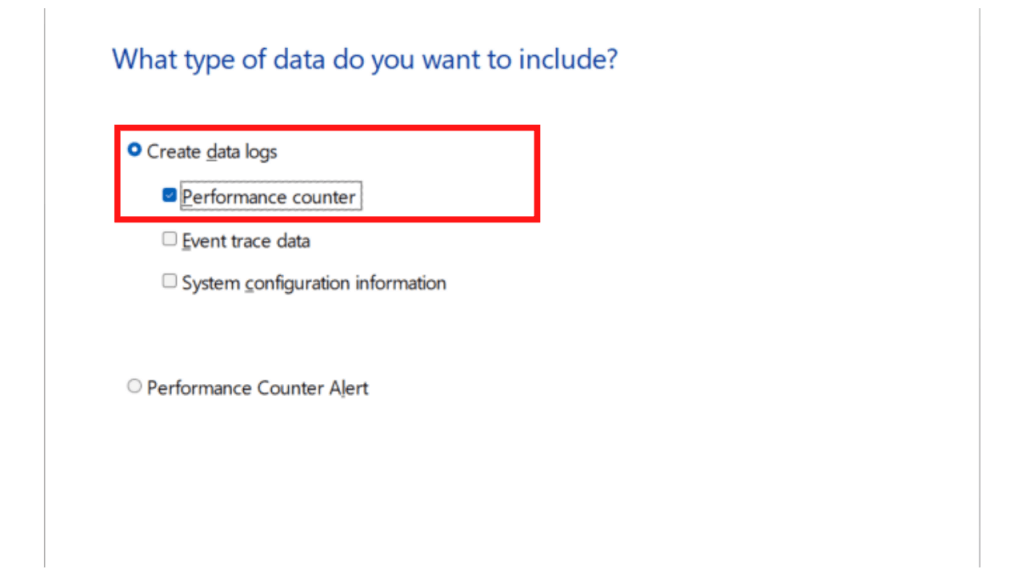 Fig. 9: Select Performance Counters as the Option
3. In step 3, I configure the counters to be captured at a 15-second sample interval. Then I begin adding the counters. Fig. 11 shows the complete set of SQL Server related counters I have chosen for this demo.
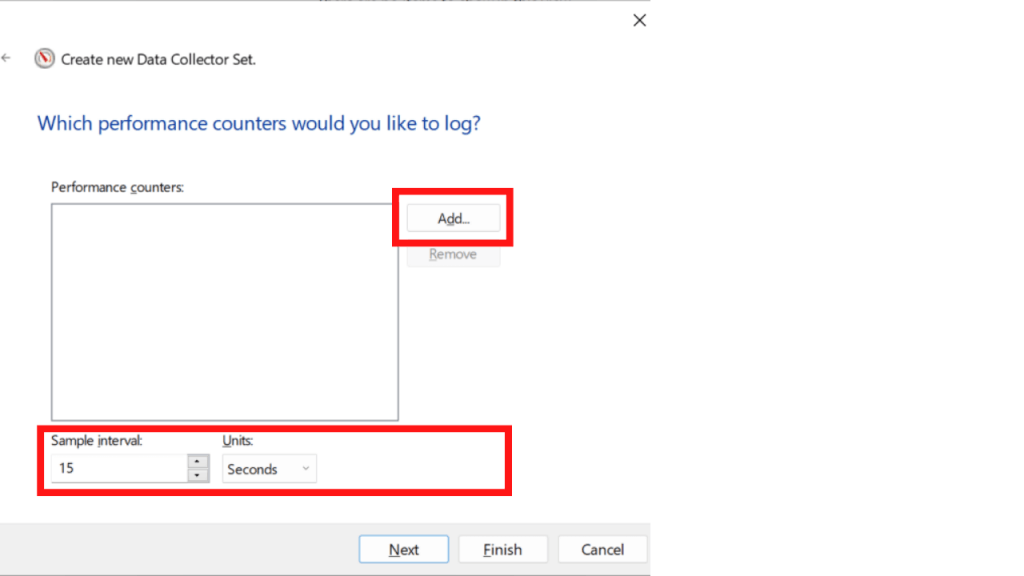 Fig. 10: Select Sample Interval
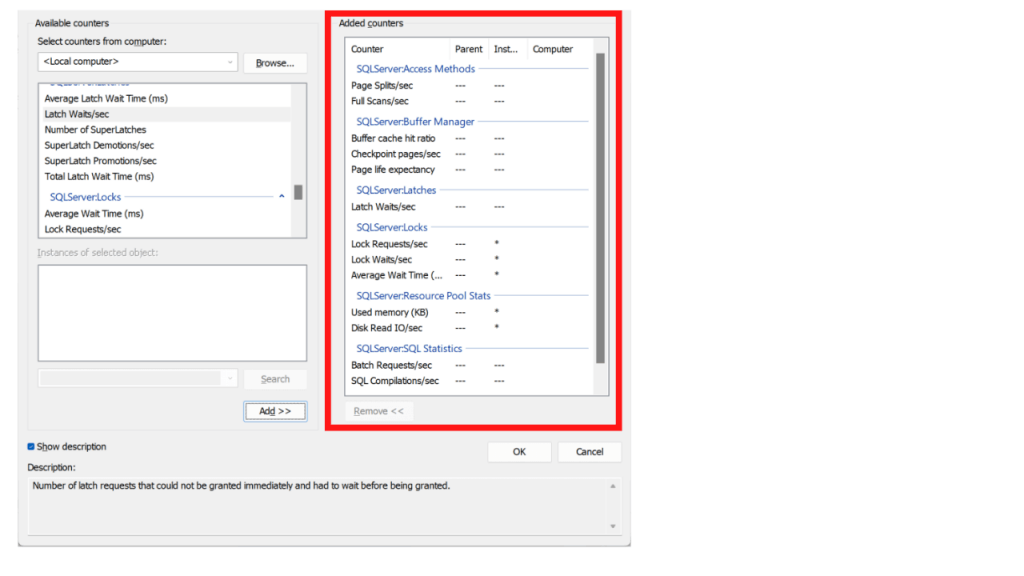 Fig. 11: Select SQL Server Counters
4. These selected counters reflect in the Create New Data Collector Set wizard and I proceed.
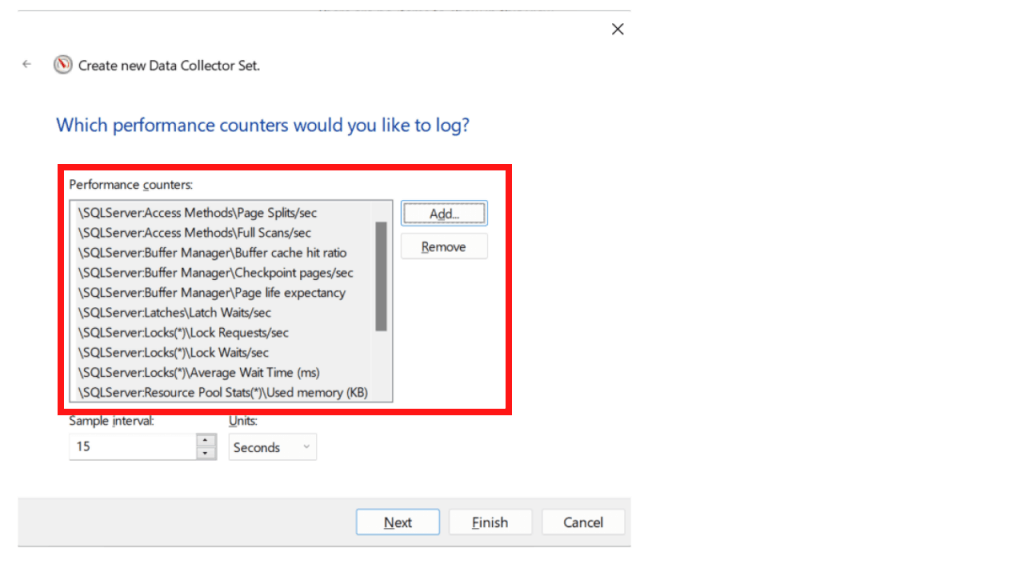 Fig. 12: Create Data Collector Set - Selected Counters
5. Step 5 shows the directory where my DCS output files will be stored. This can be customized but we leave it as default in this demo. My system directory is drive C, so my actual path is C:\PerfLogs\Admin\SQL Server DCS.
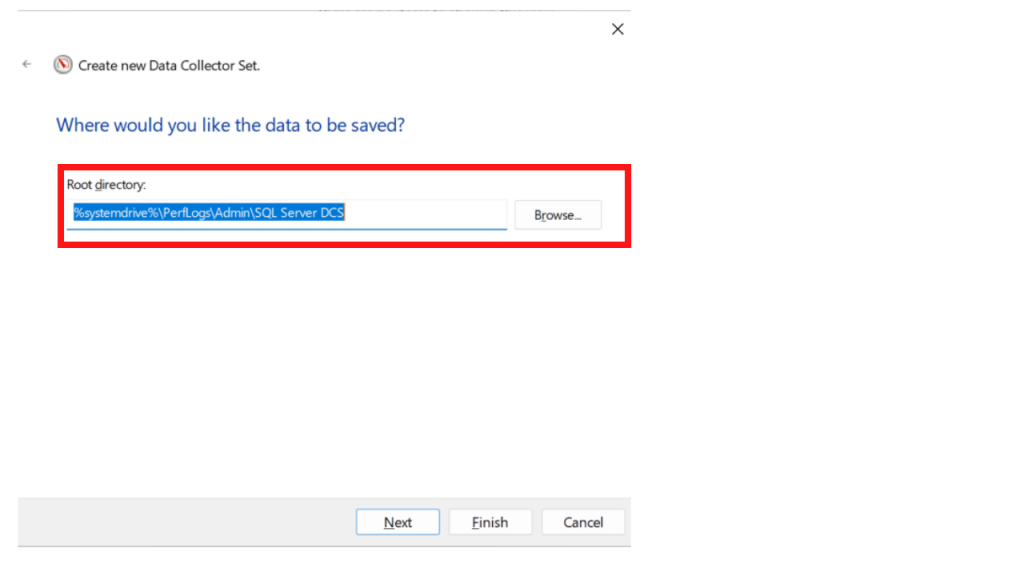 Fig. 13: Location for Data Collector Set Data
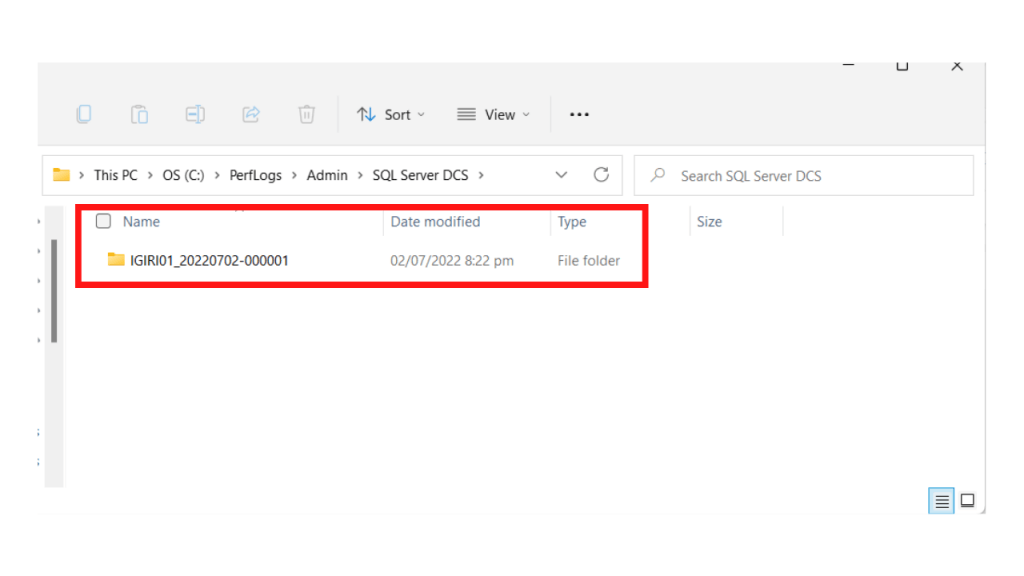
Fig. 14: Directory Location for Data Collector Set Data
6. Finally, we opt to start the collector set.
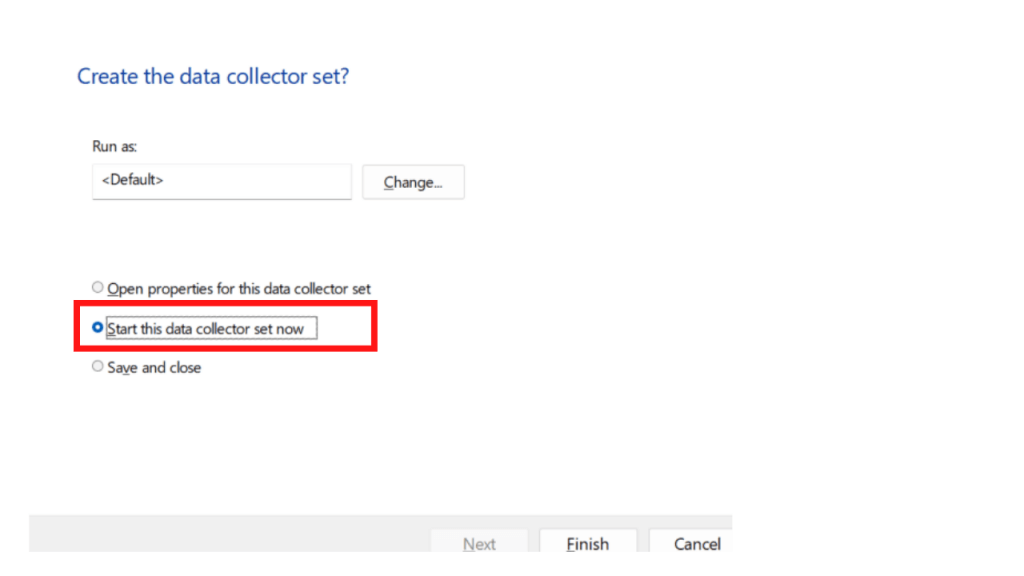 Fig. 15: Start Data Collector Set
Processing Logfiles with PAL
In the path, C:\PerfLogs\Admin\SQL Server DCS\IGIRI01_20220702-000001, we find a file named DataCOllector01.blg. This is the output file being written by the Data Collector Set until it is stopped. In practice, we had to schedule the Data Collector Set to restart at midnight daily, that way we have a different file for each day. Opening this file shows a performance monitor dashboard similar to what we saw wen we executed perfmon from the run menu.
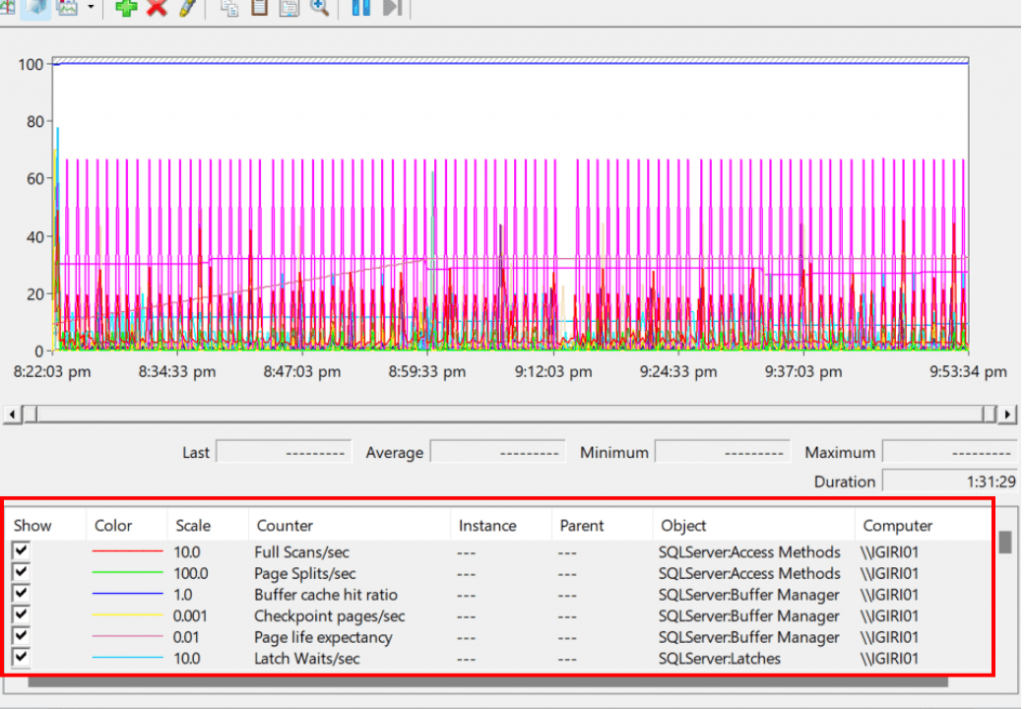 Fig. 16: Binary Log File Output of Data Collector Set
Because of the large number of counters, this view may not prove very useful. However, we can further analyze the file using a tool known as Performance Analysis for Logs (PAL). Recent documentation can still be found for PAL in the Microsoft article Using the Performance Analysis for Logs ((PAL) Tool. PAL can be downloaded from Clint Hufffman’s Git repository: https://github.com/clinthuffman/PAL.
Setting Up PAL is a simple set of steps as shown in the following screen shots.
- Start the PAL set up wizard we just downloaded from GitHub.
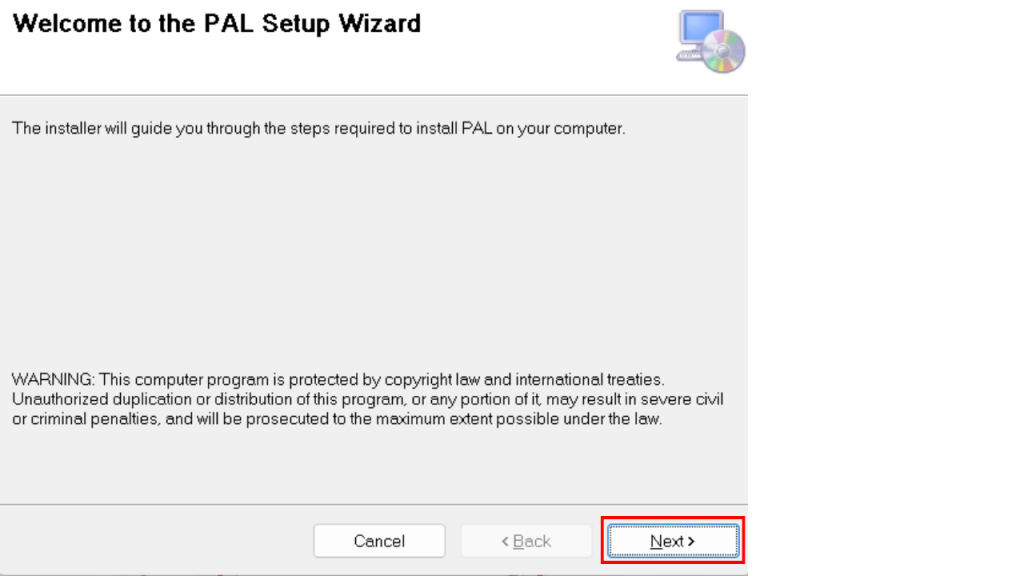 Fig. 17: PAL Setup Wizard Step 1
2. The installation directory is shown.
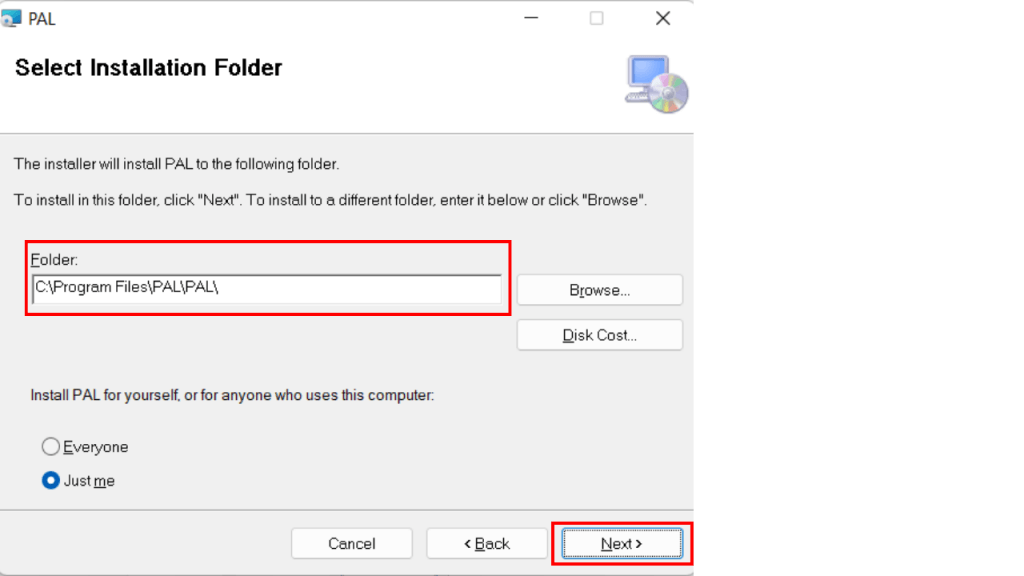 Fig. 18: PAL Setup - Selecting Installation Folder
3. Confirm installation.
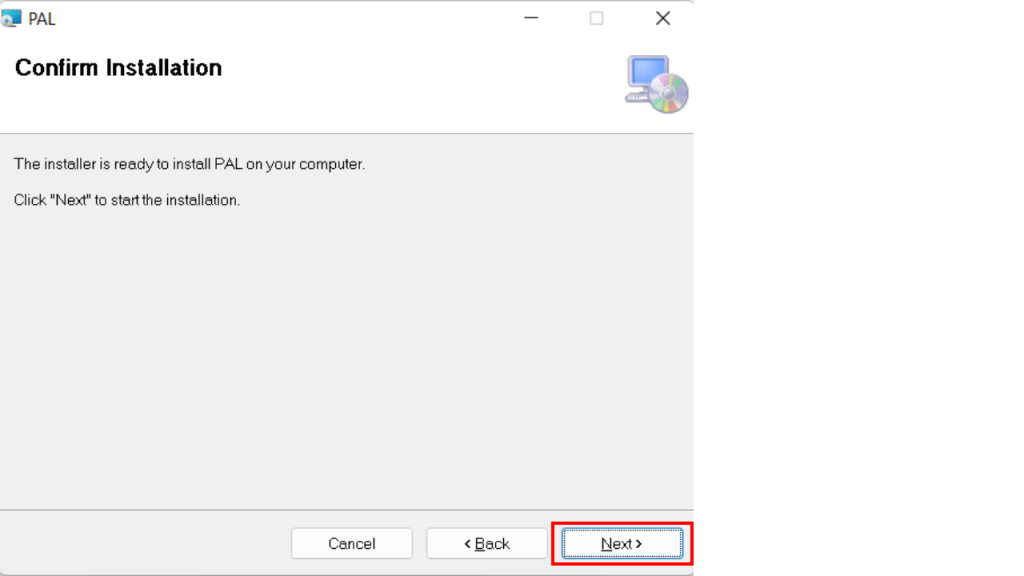 Fig. 19: Confirm Installation
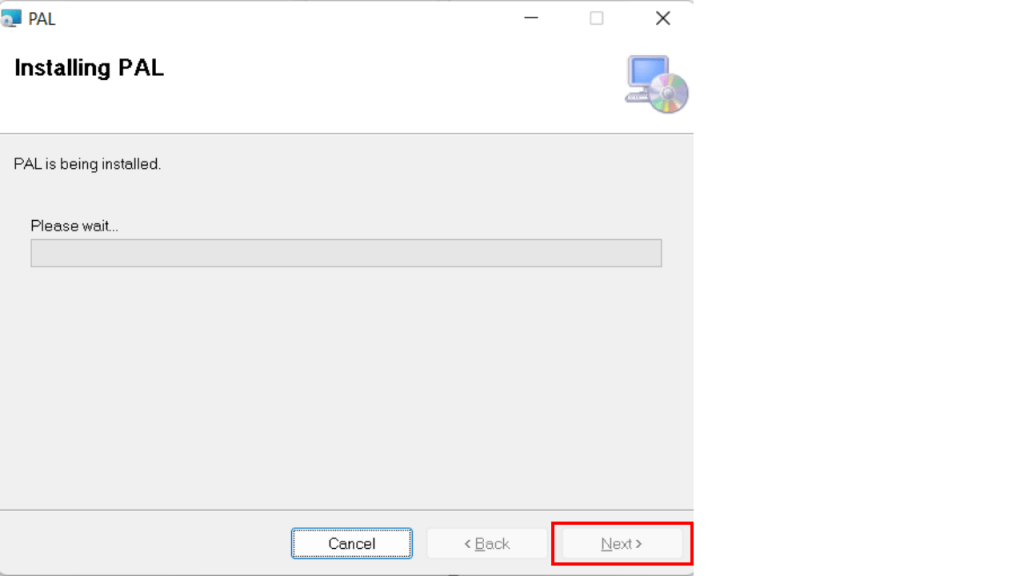 Fig. 20: Installation Progress
4. Complete installation.
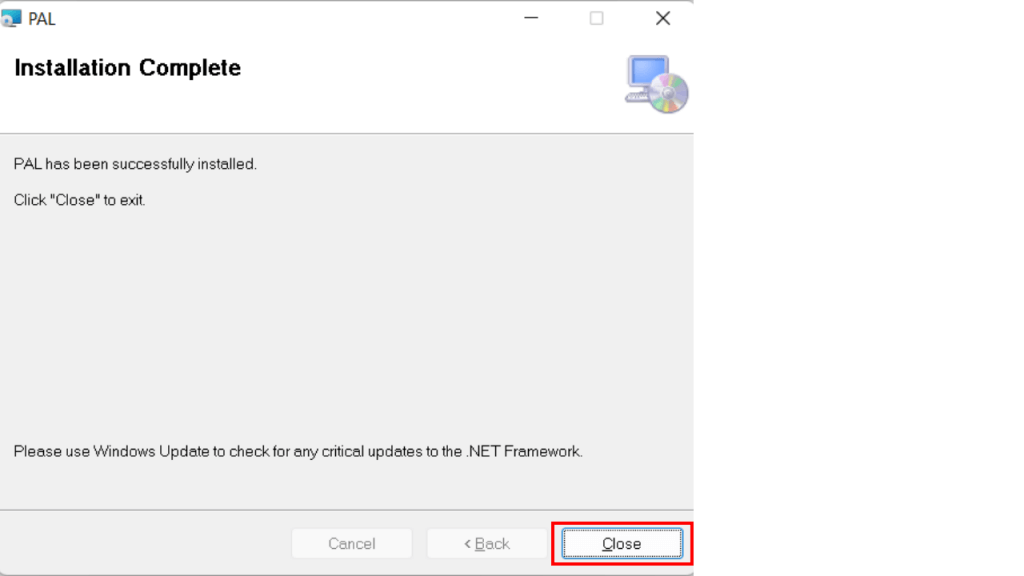 Fig. 21: PAL Installation - Installation Complete
We just installed PAL so we can use it to analyze our Data Collector Set Performance Counter output logs. Once PAL is installed, we run the programme as shown in the following steps.
- Fig. 22 shows the first step when running PAL. Notice the window shows the number of steps we have to go through as tabs.
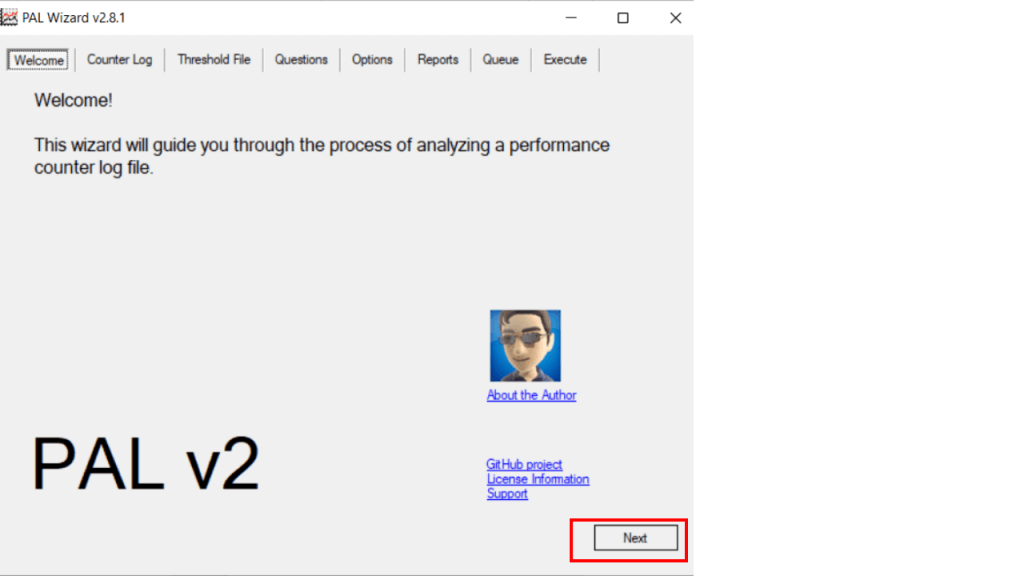 Fig. 22: Processing a DCS Output File - Step 1
2. We then select the binary (.blg) file which was produced by our Data Collector Set configuration by click the browse button.
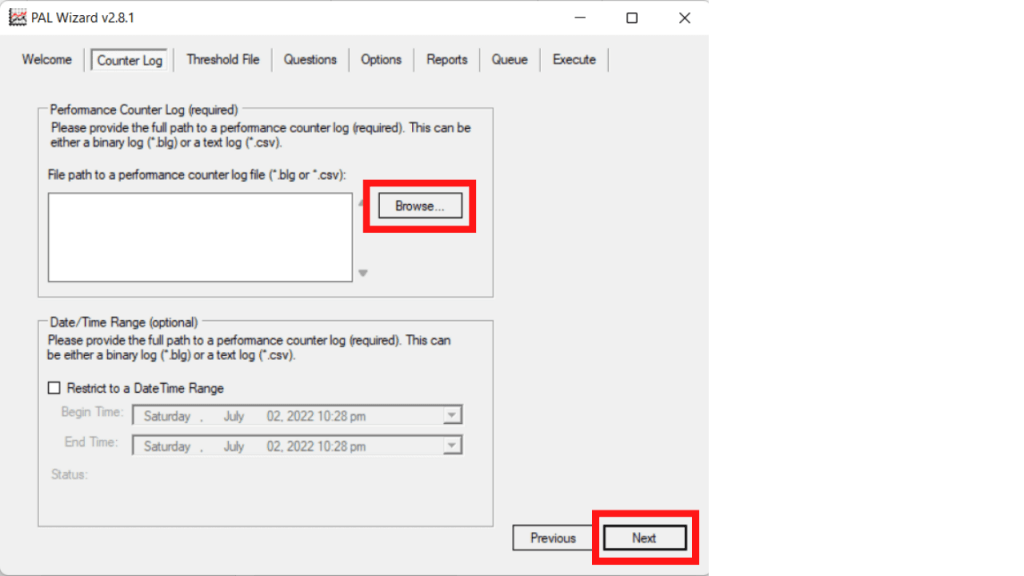 Fig. 23: Select Performance Counter Log
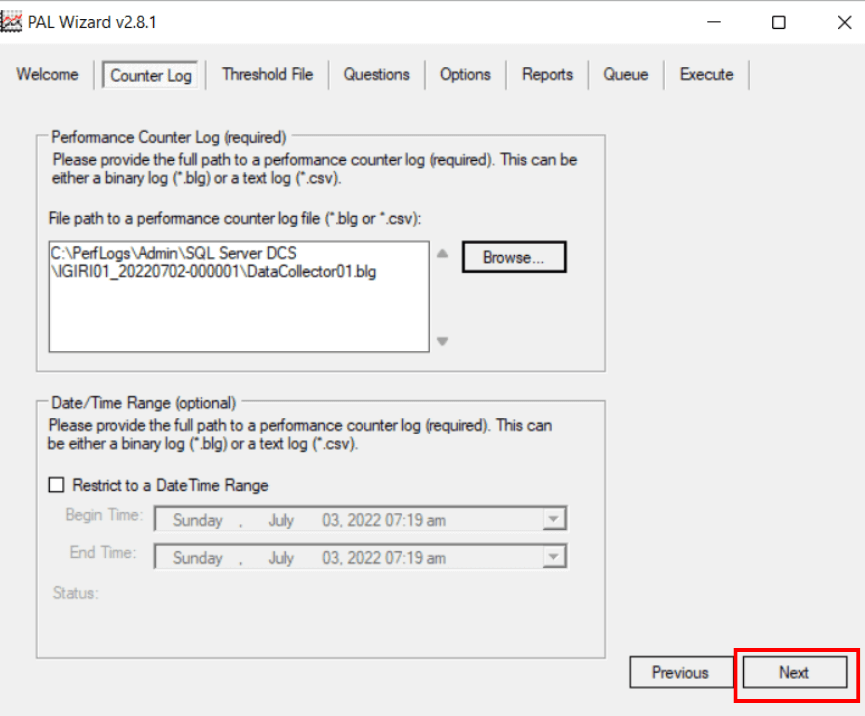 Fig. 24: Selected Performance Counter Log
3. In this step, we select a threshold file by selecting a “Title” from the menu. The threshold file determines how the log file will be analyzed. In this case, I have chosen the threshold file for latest version of SQL Server supported by this version of PAL (Fig. 26).
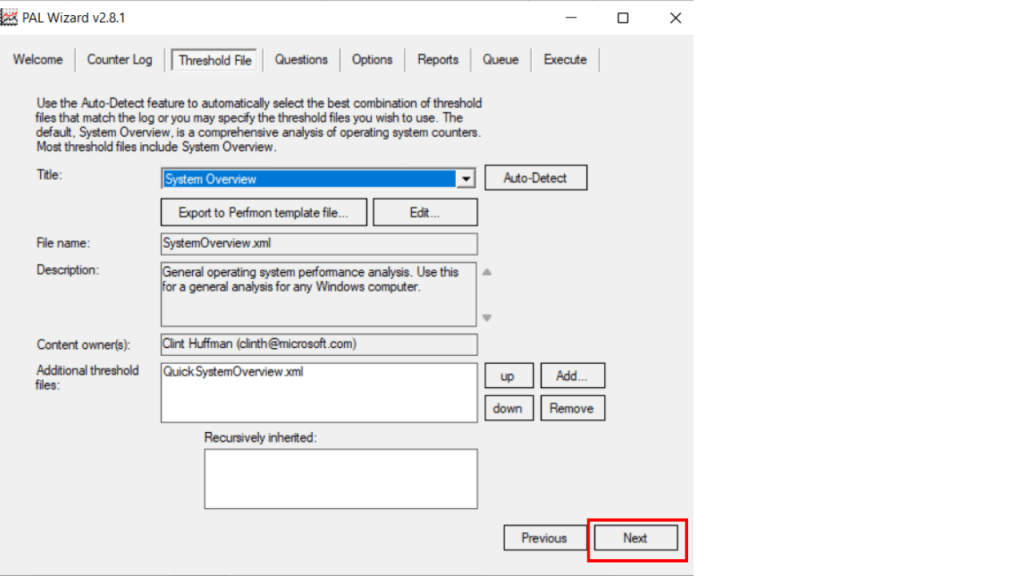 Fig. 25: Select Threshold File
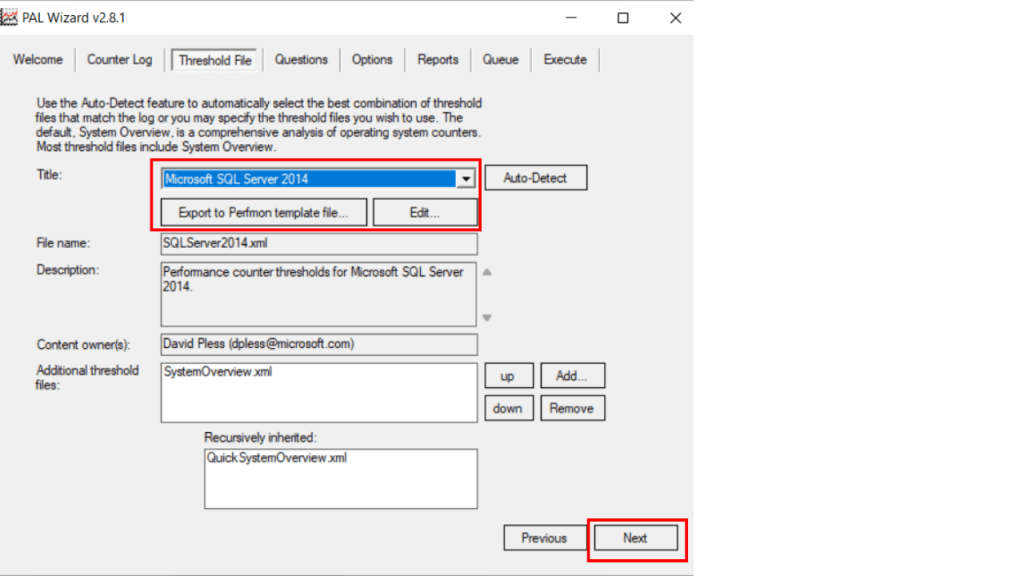 Fig. 26: Select SQL Server Threshold File
4. Step 4 allows us provide more information about the system we are analyzing by answering questions about the system configuration. This is expected to give more accurate results. Focusing on key information, we indicate that our SQL Server instance is an OLTP instance and we have 12 GB of RAM.
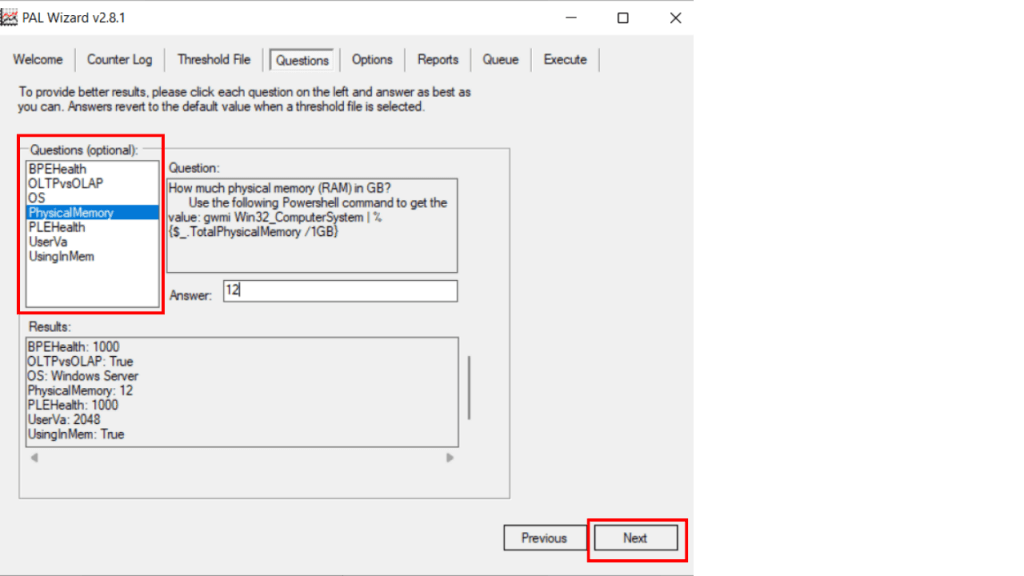 Fig. 27: Describe the System Being Evaluated
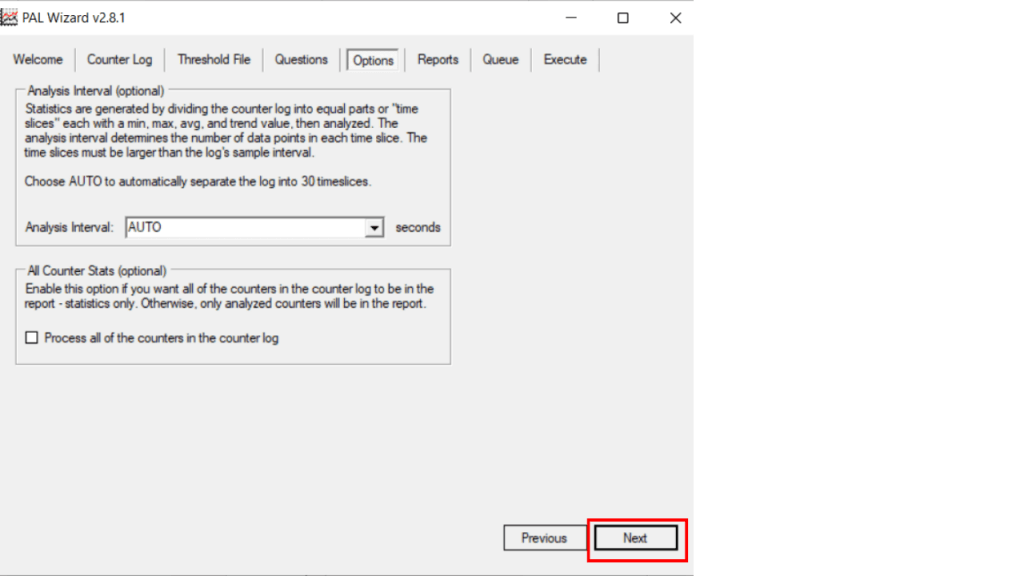 Fig. 28: Select Analysis Interval (Leaving as Default)
5. The PAL tool the selects a destination directory for the report and generates a batch file with the options chosen that will be used to analyze the log. We also select that we want to publish our report as HTML.
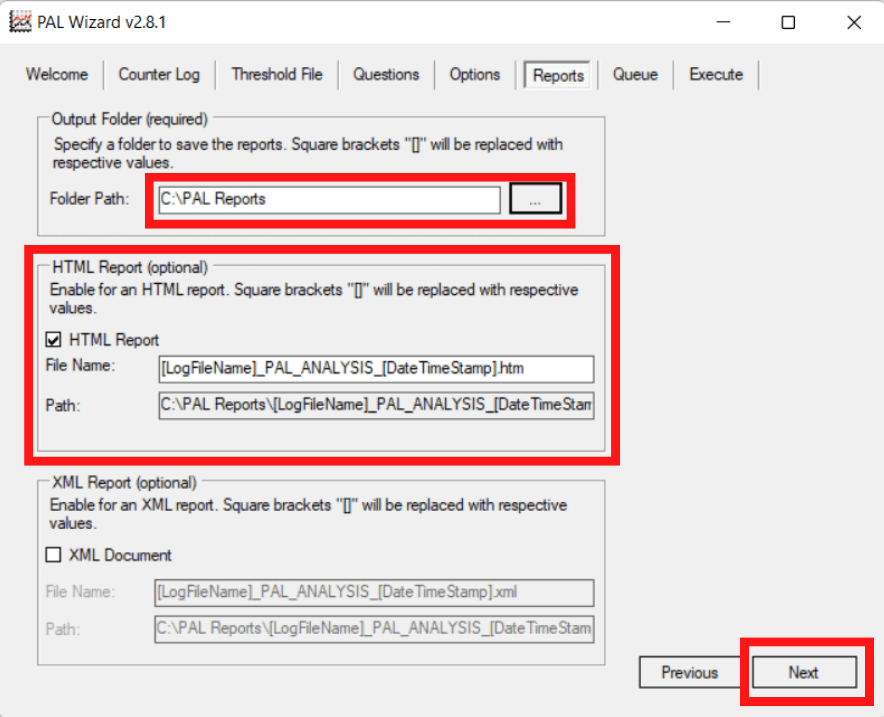 Fig. 29: Define Output Folder for PAL Reports
6. In this step we review the main options we have selected. These options are written to a batch file which will be used to analyze the performance logs.
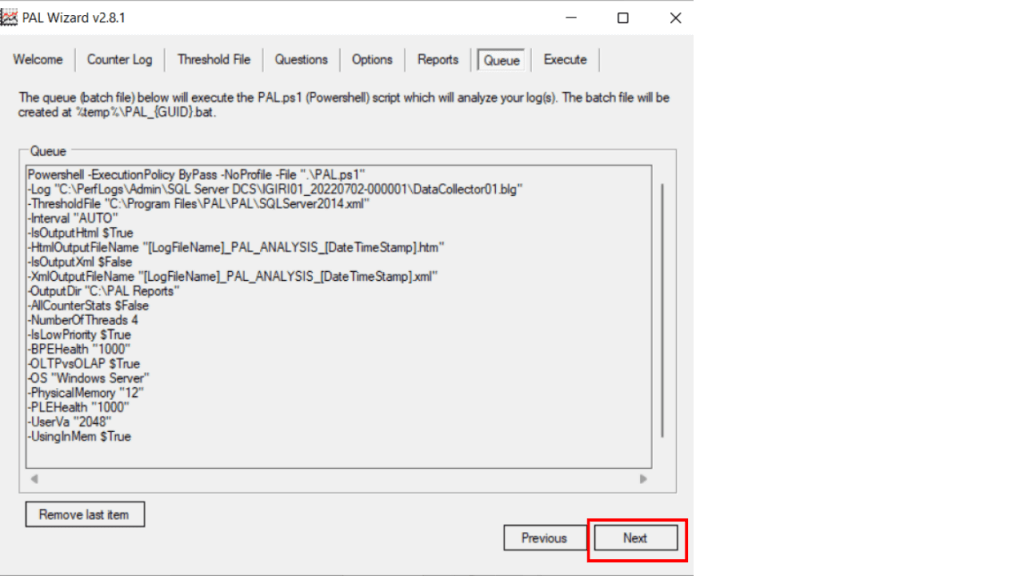 Fig. 30: Summary of Selected Options
7. In the last step, we opt to start execution.
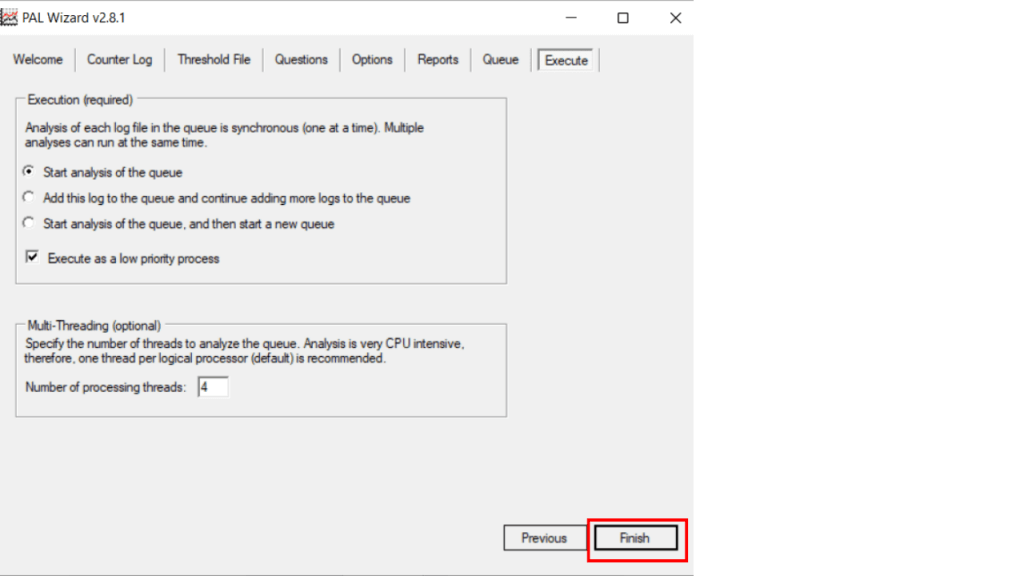 Fig. 31: Begin Execution of the Analysis
8. PAL executes a set of PowerShell scripts and then generates an HTML file.
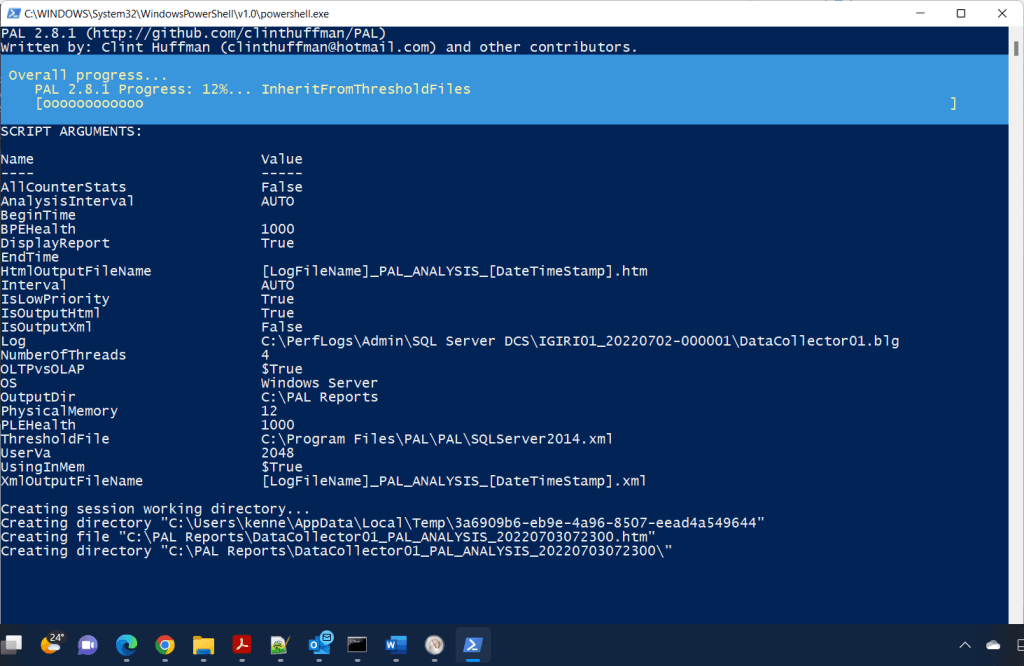 Fig. 32: Capture Inputs and Prepare Files and Directories
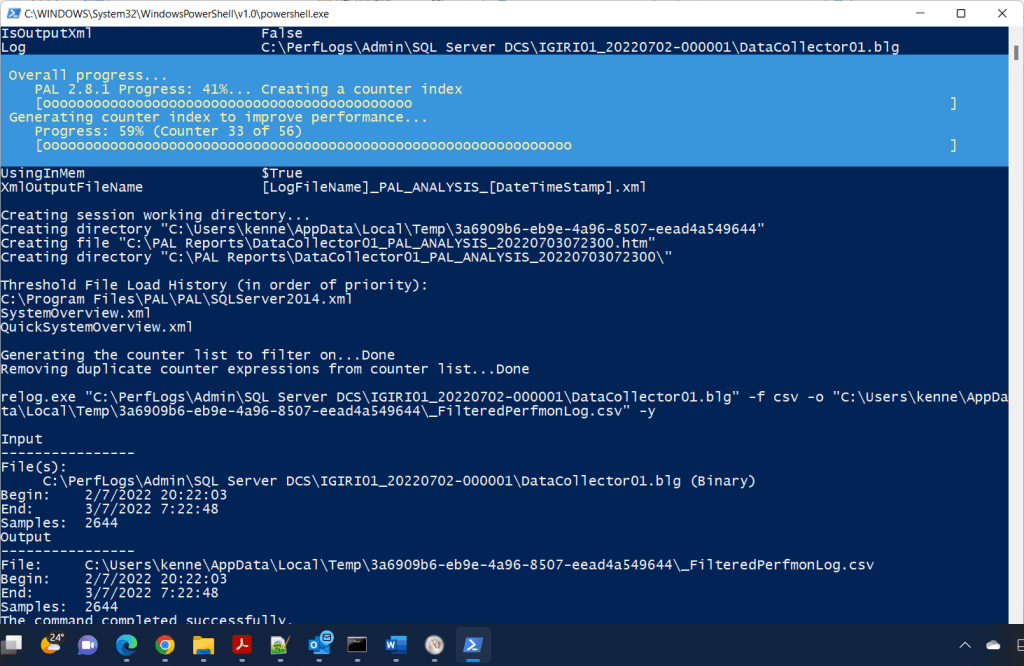 Fig. 33: Capture Inputs and Prepare Files and Directories
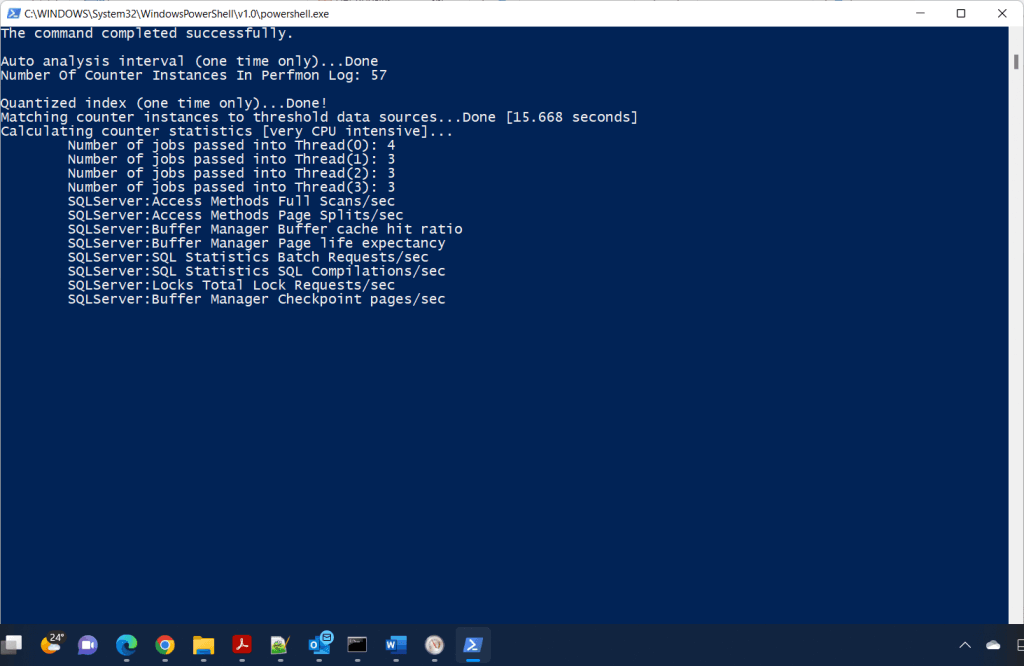 Fig. 34: Analyze PerfMon Counter Instances
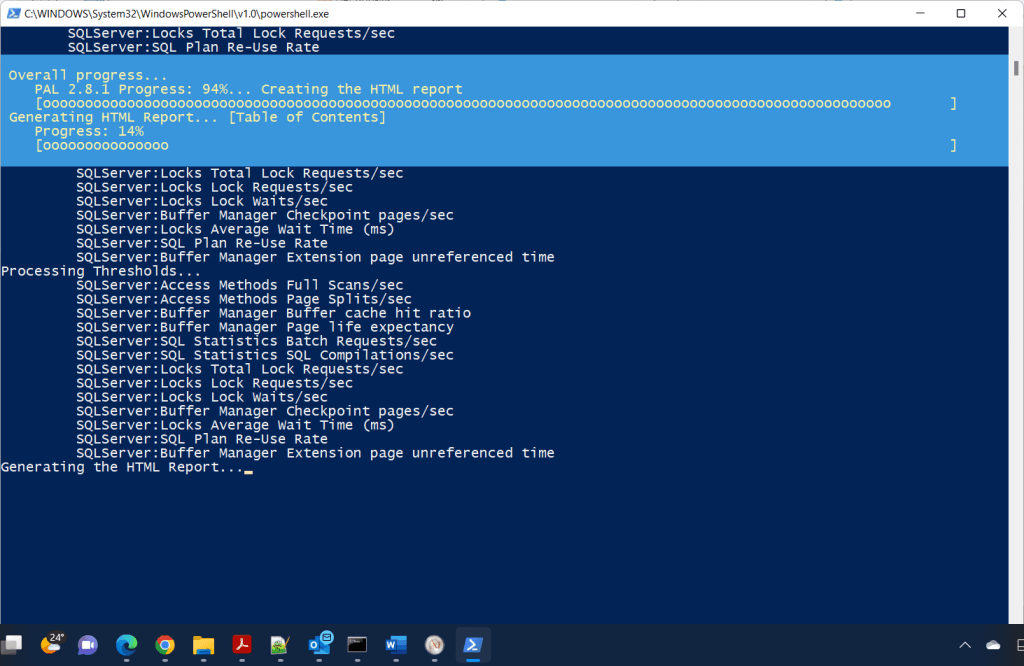 Fig. 35: Complete Process and Generate HTML Report
Conclusion
In this article, we have examine Performance Monitor (PerfMon) and how we can use it to monitor SQL Server performance counters. We also went further to demonstrate the use of Data Collector Sets. In the author's experience, this approach to monitoring SQL Server performance was a useful at a time when there was no appetite to procure third party tools like Redgate SQL Monitor, Devart dbForge Studio, and SentryOne SQL Sentry - a step further from running scripts manually when you are on a budget. The HTML output file produced by PAL shows a very rich analysis of the analyzed counters (huge kudos to Mr. Huffman). You can watch the review of the output HTML file in this video. The file is also attached to this article.
References
Performance Counters for CPU Usage, Memory, Disk and Network Performance
SYS-DM-OS- Performance Counters
Querying Performance Counters from SQL Server
Windows Performance Counters for SQL Server
Using the Performance Analysis for Logs (PAL) Tool
SQL Server Performance Counters to Monitor