

As a database administrator, you're often required to maintain other components apart from SQL Server, from installation to performance tuning and, hopefully not, troubleshooting. Most probably you're already monitoring SQL Server Error Log, but the other components (SSRS, SSAS, etc.) don't have an easy way to monitor them. You must be aware that these components do have logging enabled by default and you must monitor them proactively, in order for you to not get surprises, and for your customer to acclaim your knowledge about their assets.
Event Viewer
Let's see how to get Event Viewer entries related to your SQL Server components. Make sure you have created your exception table, otherwise comment out line 23. If you can't run xp_cmdshell (enabling it is a bad practice) you can only run the PowerShell command and read this article on how to send the results via email:
Get-EventLog -LogName Application -EntryType Warning,Error -Source MSSQL*,SQL*,*OLAP*,Report*,Failover* -After (Get-Date).AddMinutes(-15).ToString(''MM/dd/yyyy hh:mm'') | select TimeGenerated, Source, EntryType, MessageThe following T-SQL query which does call the PowerShell command using xp_cmdshell returns this information filtered:
USE [master]
DECLARE @cmd VARCHAR(8000), @IntervalMinutes INT, @RowNum INT, @PosStart INT, @PosEnd INT
SET @IntervalMinutes = 15
SET @cmd = 'powershell.exe -command "$Host.UI.RawUI.BufferSize = New-Object Management.Automation.Host.Size(512,512); Get-EventLog -LogName Application -EntryType Warning,Error -Source MSSQL*,SQL*,*OLAP*,Report*,Failover* -After (Get-Date).AddMinutes(-'+CAST(@IntervalMinutes AS CHAR(4))+').ToString(''MM/dd/yyyy hh:mm'') | select TimeGenerated, Source, EntryType, Message | Format-Table -Property * -AutoSize | Out-String -Width 512"'
CREATE TABLE #Info ([Id] INT IDENTITY(1,1), [Text] VARCHAR(MAX), [LogDate] DATETIME, [ProcessInfo] VARCHAR(1000))
INSERT INTO #Info([Text]) EXEC xp_cmdshell @cmd
UPDATE #Info SET [Text]=LTRIM(RTRIM([Text]))
SELECT TOP 1 @RowNum=[Id] FROM [#Info] WHERE LEFT([Text],1)='-'
DELETE FROM #Info WHERE [Text]='' OR [Text] IS NULL
;WITH [cte] AS (
  SELECT [Id], [Text]
    FROM #Info
   WHERE ISDATE(LEFT([Text], CHARINDEX(' ', [Text]))) = 0)
UPDATE [n]
   SET [n].[Text]=[n].[Text]+[cte].[Text]
  FROM [#Info] [n]
INNER JOIN [cte] ON [cte].[Id]-1=[n].[Id]
SELECT @PosStart=CHARINDEX('-',[Text],CHARINDEX(' ',[Text])) FROM #Info WHERE [Id]=@RowNum
SELECT @PosEnd=CHARINDEX(' ',[Text],CHARINDEX('-',[Text],CHARINDEX(' ',[Text],@PosStart))) FROM #Info WHERE [Id]=@RowNum
DELETE FROM #Info WHERE ISDATE(LEFT([Text], CHARINDEX(' ', [Text]))) = 0
UPDATE #Info SET [LogDate] = LEFT([Text], @PosStart-1), [ProcessInfo] = SUBSTRING([Text], @PosStart, @PosEnd-@PosStart)
UPDATE #Info SET [Text] = SUBSTRING([Text], @PosEnd+1, LEN([Text])-@PosEnd)
DELETE [n] FROM #Info [n] INNER JOIN [tbl_ErrorLogExclusion] [ln] ON [n].[Text] LIKE [ln].[stringValue]
SELECT [LogDate], [ProcessInfo], [Text] FROM #Info
DROP TABLE #Info
Line 3 sets the number of minutes for how much log you want to review, depending on your check frequency. Line 4 uses the technique described in this article, reads the Event Viewer Application Log, searching for Errors and Warnings, where the sources are SQL Server, SSAS, SSRS, SSIS, SQL Server Agent and Failover clustering; you can modify this to read other logs, read only errors, change the sources, etc. Lines 10 to 17 take care of errors that span multiple lines. And line 23 removes errors from SQL Server the same way as in this article. I ran a multi server query for 110 servers for the last 40 days, which took around 15 minutes and returned 126k records, and the output is similar to the following:
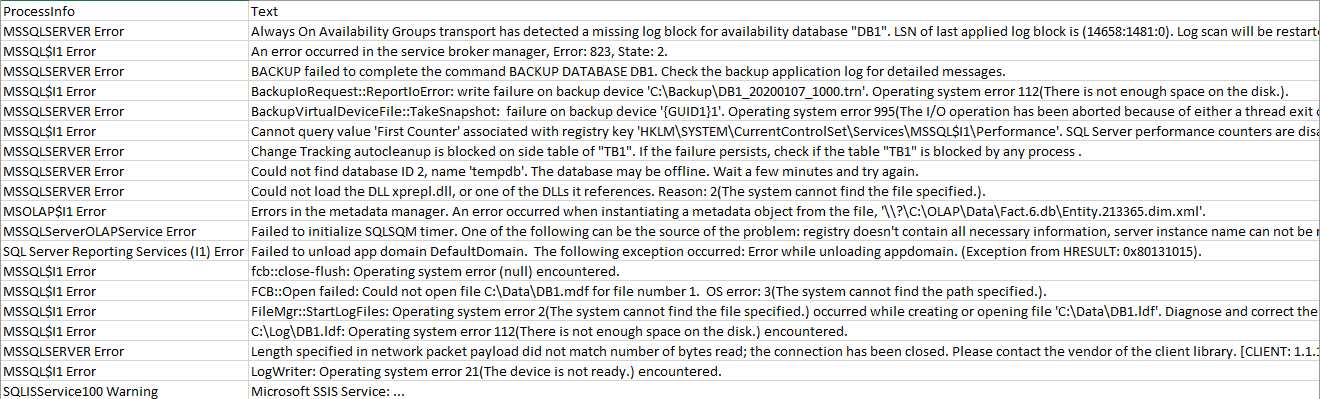
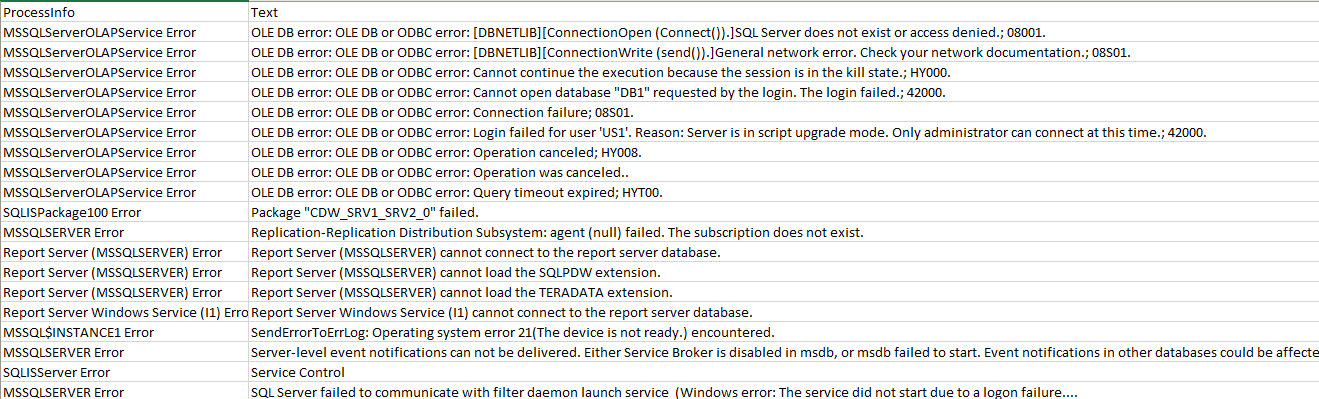
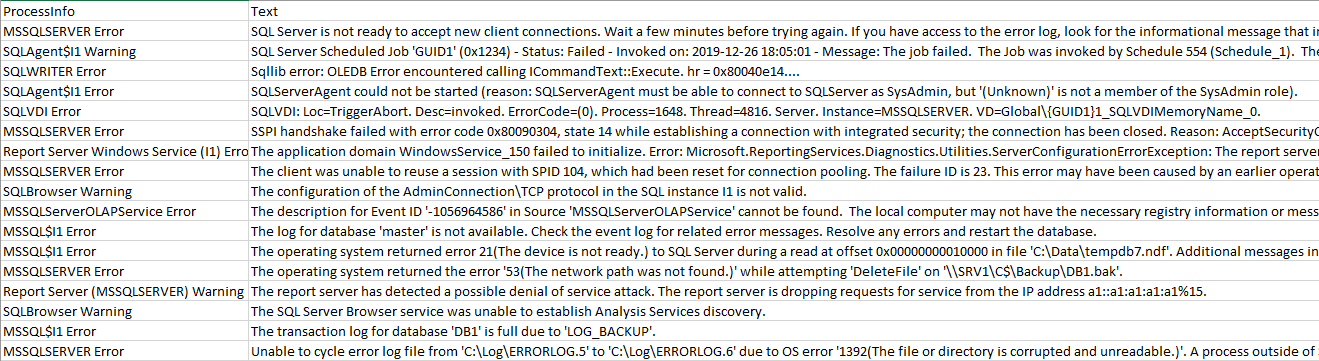
Here I'm showing all of the different errors I got. Some of them are infrastructure or programmatically related events, so you just report them to their respective teams, while the others need to get resolved before users start complaining. Note if you have multiple instances in the same server, you will get duplicated entries for all of them.
Error Dump Dir
If you suspect there are issues with your SQL Server components, each of them has a dump dir with a little more detail about each error and warning. SQL Server dumps the error log, the agent error log, the full text logs (SQLFT*, FDLAUNCH*), the default trace, and sometimes a sqlsrvr.exe and sqldmpr.exe minidump files (.log and .mdmp). Analysis Services dumps the error log (msmdsrv.log), Flight Recorder trace, and sometimes a msmdsrv.exe and sqldmpr.exe minidump files (.log and .mdmp). Reporting Services dumps the ReportServerService logs, and sometimes a sqldmpr.exe minidump files (.log and .mdmp). However, the default location for them is not easy to retrieve in an automated way.
For SQL Server, the following query returns this path from the registry, and it is accurate most of the time:
DECLARE @Folder NVARCHAR(512)
EXEC [master].[dbo].[xp_instance_regread] N'HKEY_LOCAL_MACHINE', N'Software\Microsoft\MSSQLServer\CPE', N'ErrorDumpDir', @Folder OUTPUT
SELECT @Folder
For Analysis Services, you need to know the instance name (something like MSAS13.MSSQLSERVER for the default instance, MSAS13.NAMEDINSTANCE for your named instance) because you need to match the registry exactly, and this query returns the path:
DECLARE @Folder NVARCHAR(512)
EXEC [master].[dbo].[xp_regread] N'HKEY_LOCAL_MACHINE', N'Software\Microsoft\Microsoft SQL Server\MSAS10_50.MSSQLSERVER\CPE', N'ErrorDumpDir', @Folder OUTPUT
SELECT @Folder
For Reporting Services, this is not stored in the registry, so you need to know the instance name (something like MSRS13.MSSQLSERVER for the default instance, MSRS13.NAMEDINSTANCE for your named instance) and the path is similar to the following:
D:\Program Files\Microsoft SQL Server\MSRS13.MSSQLSERVER\Reporting Services\LogFiles
Once you know your dump paths, you can get the files that were modified recently with the following query:
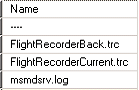
EXEC xp_cmdshell 'powershell.exe -command "Get-ChildItem \\SERVER1\c$\OLAP\Log | Where {$_.LastWriteTime -gt (Get-Date).AddDays(-2)} | select Name | Format-Table -Property * -AutoSize | Out-String -Width 1000"'This assumes your SERVER1 C: drive is accessible from the network, and the path you want to analyze is C:\OLAP\Log, then it will return the files that were modified in the last two days:
If you want to view the latest entries written into a text file before digging further, you can do so with the following command:
EXEC xp_cmdshell 'powershell.exe -command "Get-Item -Path \\SERVER1\C$\OLAP\Log\msmdsrv.log | Get-Content -Tail 25 | Format-Table -Property * -AutoSize | Out-String -Width 1000"'
It will return the last 25 lines from the file for you to view if an error was logged recently:

Error dump files
You have already checked the event viewer and the dump dir, and you need to investigate further or provide evidence of what the issue is, then you need to open the minidump file (.mdmp) and analyze its content. This requires a higher level of expertise because you won't get the source code neither a clear error message about what the issue is; you will only get a call stack of what instructions may have caused the issue, one call stack for each processor thread, and you must identify: which thread failed, if another thread caused it to fail, if all threads were running fine but the system resources were overloaded, etc. And most likely you will only discover that it is a bug to be fixed on the next Cumulative Update.
The first step is to install WinDbg or similar, in my case I went to the following URL and downloaded the .iso file:
https://developer.microsoft.com/en-us/windows/downloads/windows-10-sdk
Then I uncompressed it and installed only the Debugging Tools for Windows; this doesn't need to be done on every server, only on one of them (assuming your network paths are accessible from this server).
Once it has been installed, I can create a local cache folder for the symbols I will download (i.e. C:\symbols) and set the environment variable for the symbols as follows:
SET _NT_SYMBOL_PATH=srv*C:\symbols;srv*\\SERVER1\C$\Program Files\Microsoft SQL Server\MSAS14.MSSQLSERVER\OLAP\bin;srv*http://msdl.microsoft.com/download/symbols;
And finally, I can launch WinDbg pointing to a specific dump file with the following command:
"C:\Program Files (x86)\Windows Kits\10\Debuggers\x64\windbg.exe" -z \\SERVER1\C$\OLAP\Log\SQLDmpr0288.mdmp
In this case I launched the 64 bit program because the dump file was created in a 64 bit OS. If you want to learn more about analyzing a minidump file, I recommend you to view the video SQL Server Dump Analysis- sponsored by Dell Software.
Conclusion
It's very important that you know your servers problems before users notice them, so you can resolve them promptly and that's another way you can justify your job. It is not enough to monitor the SQL Server error log, there are other events that get logged in Event Viewer that you won't notice, like network and storage problems. And you must also monitor the error dump folders for issues that you didn't know were occurring because are logged in different files. If you're curious enough, you can also analyze the .mdmp files with WinDbg and learn a bit more about how things work.

