

Although not every business has SSAS (SQL Server Analysis Services) installed nor use it extensively, the ones who do also care about their database responsiveness. If it is slow, what else is running that may be causing the slowness? Are there any locks? What commands are being run, who is running them, from where? How much of every resource are those queries consuming, so you can adjust the amount dedicated to OLAP, either balance it with the OLTP, or add more memory? Or may it need an aggregation to reduce the amount of work being done?
All of this information is available, but you don't have an Activity Monitor neither can write MDX queries to discover it. Just like there is a procedure to view current activity in a transactional database (sp_WhoIsActive), we need the same type of script for the analytical databases.
The query below allows you to view this information at the moment of execution, the only thing it needs is a linked server to your OLAP database, and you're ready to go. In the script below, replace <OLAPLINK> with your SSAS server.
DECLARE @TZOffset INT, @IntervalMinutes INT, @CurTime DATETIME
SET @TZOffset = 6
SET @IntervalMinutes = 240
SET @CurTime = DATEADD(hh, @TZOffset, GETDATE())
-- Locks at current point in time. Should be as minimum as possible.
SELECT CAST([SPID] AS INT) [SessionId], CAST([LOCK_ID] AS VARCHAR(MAX)) [LockId], * INTO #Locks
FROM OPENQUERY(<OLAPLINK>, 'SELECT [SPID], [LOCK_ID], [LOCK_TRANSACTION_ID], [LOCK_OBJECT_ID], [LOCK_STATUS], [LOCK_TYPE], [LOCK_CREATION_TIME], [LOCK_GRANT_TIME] FROM [$SYSTEM].[DISCOVER_LOCKS]')
-- current set of pending transactions on the system
SELECT CAST([TRANSACTION_SESSION_ID] AS VARCHAR(MAX)) [SessionGUID], * INTO #Transactions
FROM OPENQUERY(<OLAPLINK>, 'SELECT * FROM [$SYSTEM].[DISCOVER_TRANSACTIONS]')
-- Resource usage and activity at the moment
SELECT CAST([SESSION_SPID] AS INT) [SessionId], CAST([SESSION_ID] AS VARCHAR(MAX)) [SessionGUID], CAST([OBJECT_PARENT_PATH] AS VARCHAR(MAX))+'.'+CAST([OBJECT_ID] AS VARCHAR(128)) [Object], * INTO #CommandObjects
FROM OPENQUERY(<OLAPLINK>, 'SELECT * FROM [$SYSTEM].[DISCOVER_COMMAND_OBJECTS]')
-- Resource usage and activity about currently executing or last executed commands in the opened connections
SELECT CAST([SESSION_SPID] AS INT) [SessionId], * INTO #Commands
FROM OPENQUERY(<OLAPLINK>, 'SELECT * FROM [$SYSTEM].[DISCOVER_COMMANDS]')
-- MDX/command used by each user, which SSAS database/cube they are using, session reads and writes, how much CPU and memory is used, last command
SELECT CAST([SESSION_CONNECTION_ID] AS INT) [ConnectionId], CAST([SESSION_SPID] AS INT) [SessionId], CAST([SESSION_ID] AS VARCHAR(MAX)) [SessionGUID], * INTO #Sessions
FROM OPENQUERY(<OLAPLINK>, 'SELECT * FROM [$SYSTEM].[DISCOVER_SESSIONS]')
-- who s connecting to the server, since when, for how long, from which PC (IP) and using what client
SELECT CAST([CONNECTION_ID] AS INT) [ConnectionId], * INTO #Connections
FROM OPENQUERY(<OLAPLINK>, 'SELECT * FROM [$SYSTEM].[DISCOVER_CONNECTIONS]')
-- results
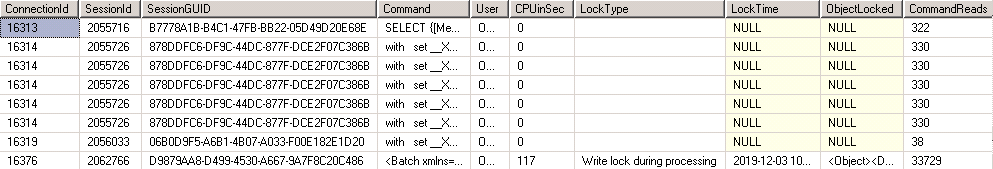
SELECT [c].[ConnectionId], [se].[SessionId], [se].[SessionGUID], [cm].[COMMAND_TEXT] [Command], [c].[CONNECTION_USER_NAME] [User], [cm].[COMMAND_CPU_TIME_MS]/1000 [CPUinSec],
CASE [l].[LOCK_TYPE] WHEN 0 THEN 'No lock'
WHEN 1 THEN 'Inactive session; does not interfere with other locks'
WHEN 2 THEN 'Read lock during processing'
WHEN 4 THEN 'Write lock during processing'
WHEN 8 THEN 'Commit lock, shared'
WHEN 10 THEN 'Commit lock, exclusive'
WHEN 20 THEN 'Abort at commit progress'
WHEN 40 THEN 'Commit in progress'
WHEN 80 THEN 'Invalid lock'
ELSE '' END [LockType], DATEADD(HH, -@TZOffset, [l].[LOCK_GRANT_TIME]) [LockTime], [l].[LOCK_OBJECT_ID] [ObjectLocked],
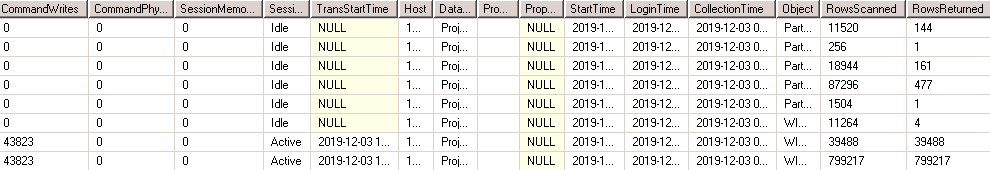
[cm].[COMMAND_READS] [CommandReads], [cm].[COMMAND_WRITES] [CommandWrites], ([cm].[COMMAND_READ_KB]+[cm].[COMMAND_WRITE_KB])/1024/1024 [CommandPhysicalIOinGB],
[se].[SESSION_USED_MEMORY]/1024/1024 [SessionMemoryinGB], CASE [se].[SESSION_STATUS] WHEN 0 THEN 'Idle' WHEN 1 THEN 'Active' WHEN 2 THEN 'Blocked' WHEN 3 THEN 'Cancelled' END [SessionStatus],
DATEADD(HH, -@TZOffset, [t].[TRANSACTION_START_TIME]) [TransStartTime], [c].[CONNECTION_HOST_NAME] [Host], [se].[SESSION_CURRENT_DATABASE] [Database],
[c].[CONNECTION_HOST_APPLICATION] [Program], [se].[SESSION_PROPERTIES] [Properties], DATEADD(HH, -@TZOffset, [cm].[COMMAND_START_TIME]) [StartTime],
DATEADD(HH, -@TZOffset, [se].[SESSION_START_TIME]) [LoginTime], DATEADD(HH, -@TZOffset, @CurTime) [CollectionTime], [co].[Object], [co].[OBJECT_ROWS_SCANNED] [RowsScanned],
[co].[OBJECT_ROWS_RETURNED] [RowsReturned]
FROM #Connections [c]
INNER JOIN #Sessions [se] ON [se].[ConnectionId] = [c].[ConnectionId]
INNER JOIN #Commands [cm] ON [cm].[SessionId] = [se].[SessionId] AND [cm].[COMMAND_START_TIME] > DATEADD(MI, -@IntervalMinutes, @CurTime)
INNER JOIN #CommandObjects [co] ON [co].[SessionId] = [cm].[SessionId] AND ([co].[OBJECT_ROWS_SCANNED] > 0 OR [co].[OBJECT_ROWS_RETURNED] > 0)
LEFT JOIN #Transactions [t] ON [t].[SessionGUID] = [se].[SessionGUID]
LEFT JOIN #Locks [l] ON [l].[LockId] = (SELECT TOP 1 [l2].[LockId] FROM #Locks [l2] WHERE [l2].[SessionId] = [se].[SessionId] ORDER BY [l2].[LOCK_TYPE] DESC)
ORDER BY [ConnectionId], [Object]
DROP TABLE #Connections
DROP TABLE #Sessions
DROP TABLE #Commands
DROP TABLE #CommandObjects
DROP TABLE #Transactions
DROP TABLE #Locks
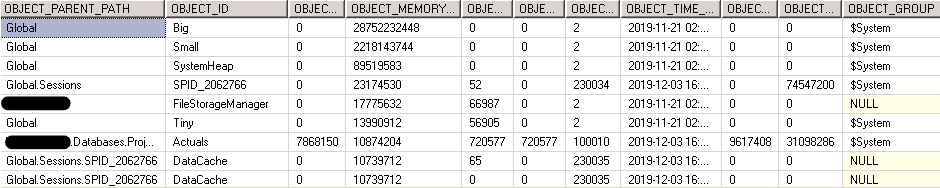
-- memory usage for each object
SELECT * INTO #ObjectMemoryUsage FROM OPENQUERY(<OLAPLINK>, 'SELECT * FROM $SYSTEM.DISCOVER_OBJECT_MEMORY_USAGE ORDER BY OBJECT_MEMORY_NONSHRINKABLE DESC')
SELECT * FROM #ObjectMemoryUsage
DROP TABLE #ObjectMemoryUsageThe variable @TZOffset allows you to adjust the time of the results with your local time. Otherwise you will see the activity as UTC and the collection time as your local time zone. The variable @IntervalMinutes allows you to exclude commands that were issued a long time ago, so if you run this script every 5 minutes, you can view only the commands executed in these last 5 minutes.
From lines 5 to 22, it is just querying the OLAP database through the linked server to get the information we're interested in. Lines 23 to 47 join the gathered results to show the information clearly. Lines 48 to 53 drop the temporary tables created. And lines 55 to 58 show the memory consumed by each object so you can detect, for example, if there is high memory utilization, which session is consuming it.
The results are similar to what is shown in the images below:
These results can be stored on every execution and from there, you gain a lot of insight on how is your activity on the OLAP database, which enables you to troubleshoot it.
