

Overview
Real-time logging and monitoring are essential for modern applications to track events, detect issues, and gain insights into system behavior. By integrating PostgreSQL with Python, we can build a powerful and efficient logging system that stores, queries, and monitors logs in real-time. In this article, we will walk through how we can achieve real-time logging into PostgreSQL database using Python and how we can monitor the logs in real-time using a 3rd party application.
Architecture
Before we dive into further details, let us understand the simple architecture in this article. We are using Python and PostgreSQL in our example. Here, a Python application will handle the log collection and log ingestion, while PostgreSQL will act as our central log database, which will record all the logs into a table in real-time. Lastly, we talked about a 3rd party application to monitor the logs, and we will be using Grafana for this. You can also use Metabase.
Initial Requirements
To start, we will need the following available in our local machine:
- Python (version 3.7 or latest)
- PostgreSQL (on local or cloud instance)
- A few necessary Python packages
The necessary Python packages are the following: psycopg2-binary and loguru. To install these, open a command prompt (or similar) and run the following command:
pip install psycopg2-binary loguru
This will download all the necessary dependencies and install them on our local system.
Step 1: Creating a log table in PostgreSQL database
First, we will create a log table in our local PostgreSQL database. This table will contain all the information for all the log statements in our application (which will be developed soon). To simplify and understand it better, we will create the table using CREATE TABLE command. In real time applications, we can have a DDL script at the application start up which will create the table if it does not exists on application start up.
Run the following command in PostgreSQL database to create the table:
CREATE TABLE logs (
    id SERIAL PRIMARY KEY,
    timestamp TIMESTAMPTZ DEFAULT NOW(),
    level VARCHAR(10),          -- e.g., INFO, ERROR, DEBUG
    service VARCHAR(50),        -- microservice or component name
    message TEXT,
    context JSONB               -- for structured logging
);
This will create a table. Let us see in brief what data it stores:
- id - an ID will be automatically generated serially when an entry is made into the table
- timestamp - the exact timestamp when the record gets inserted into the table
- level - determines the log level. Typically: INFO, WARN, DEBUG, TRACE, ERROR, etc.
- service - this will hold the name of the service. Assume you have multiple files where from the application flow goes and each file has loggers implemented. So each log will have it's own service name mentioned. Typically, this will help us understand which file was responsible for this log entry.
- message - any custom message that we want to make a note of here. This is the log message actually.
- context - contains information about the log in a JSON format which can later be queries and used to be shown in some UI (if needed).
Step 2: Indexing on the query columns
We should create some indices on columns which will be frequently used in our where clause to query the log table and collect the logs for further processing and reporting. We will run the following queries in our PostgreSQL database to create the indices:
CREATE INDEX idx_logs_timestamp ON logs (timestamp DESC);
CREATE INDEX idx_logs_level ON logs (level);
CREATE INDEX idx_logs_service ON logs (service);
Step 3: Python utility code to connect to PostgreSQL database and insert log record
Now, we will create a utility python script that will establish a connection to our local PostgreSQL database and also contain a utility function that will be used from other python scripts to record log entries into the database.
The code does the following. First, it imports the necessary dependencies which will be used to establish connection to the PostgreSQL database. It also imports the datetime dependency which will be used to format the logger date time entry.
Next, we create a database configuration which will contain the details like database name, host, port, username and password. This will later be used to establish the connection to database.
Next, we are defining a function, called insert_log, which will be invoked later from other python modules to insert log into logs table in the PostgreSQL database. It takes the necessary table column entries as parameters (which will be passed from subsequent invocation modules later). In this method:
Using the DB_CONFIG we are creating a connection. The config is stored in the DB_CONFIG variable and used in this code:
conn = psycopg2.connect(**DB_CONFIG)
Next, we are creating a cursor out of this established connection. Using this cursor, we are executing an insert statement to make an entry into the logs table in our PostgreSQL database. Next, we are committing the transaction and closing the cursor.
        cur = conn.cursor()
        cur.execute("""
            INSERT INTO logs (timestamp, level, service, message, context)
            VALUES (%s, %s, %s, %s, %s)
        """, (
            timestamp or datetime.utcnow(),
            level,
            service,
            message,
            Json(context or {})
        ))
        conn.commit()
        cur.close()
We are also letting the user know that log insertion was successfully completed. In case of any exception, we are printing to the console that log insertion operation failed. Finally, we are closing the connection (irrespective of successful or failed operation).
Following is the code snippet, which we save as db_logger.py:
import psycopg2
from psycopg2.extras import Json
from datetime import datetime

DB_CONFIG = {
    'dbname': 'testdb',
    'user': 'testuser',
    'password': 'testpass',
    'host': 'localhost',
    'port': 5432,
}


def insert_log(level, service, message, context=None, timestamp=None):
    """
    Inserts a log entry into the logs table.

    Args:
        level (str): Log level (e.g., INFO, ERROR).
        service (str): Name of the service or component.
        message (str): Log message.
        context (dict): Optional structured context.
        timestamp (datetime): Optional custom timestamp.
    """
    conn = None
    try:
        conn = psycopg2.connect(**DB_CONFIG)
        cur = conn.cursor()
        cur.execute("""
            INSERT INTO logs (timestamp, level, service, message, context)
            VALUES (%s, %s, %s, %s, %s)
        """, (
            timestamp or datetime.utcnow(),
            level,
            service,
            message,
            Json(context or {})
        ))
        conn.commit()
        cur.close()
        print(f"Log inserted: {level} - {message}")
    except Exception as e:
        print(f"Failed to insert log: {e}")
    finally:
        if conn:
            conn.close()
Note that this file has no use on its own. This is a utility module that will be invoked from other python modules when a logging is needed to be done.
Step 4: Python module code to insert a log record
Now, we will create a python script (custom_logger_handler.py) that will attempt some log entries from the application subsequently transferring them into the PostgreSQL database. In real time, there will be different python modules (or as you say service components) which will import the above utility file and reuse the insert_log function on each logging action. We, on the other hand, for keeping it simple and easy to understand, will create a python script which logs with different logging levels and service names for different numeric inputs.
To understand it better, let's see the below explanation:
- We will take a input parameter in the python script which can be numeric.
- The numeric input range will vary from 1 through 5, each for different logging level and service name.
- As an example, if we pass 1 as a parameter, it will log at logging level INFO with service name as auth-service (assume that this means the logger was invoked from an auth-service class at INFO level).
- Similarly, for example, if we pass 2 as a parameter, it will log at logging level ERROR with service name as payment-service (assume that this means the logger was invoked from a payment-service module for some error it observed during processing a payment).
The code does the following: First, it imports sys since we will be using the same to read the argument(s) provided by the invoker. It also imports insert_log from the db_logger utility file (as we said we will reuse that method to log events). Lastly, we import logging since we will override the default logger to ensure that it hits the PostgreSQL database.
Next, we are defining a class, called DBLogHandler, which is the game changer. Generally, when we call a function on logger (say logger.error), it logs into a log file. But we need the log to be stored in our database. So here we will override the basic logger functionality to be mapped to database operation. DBLogHandler inherits from logging.Handler and overrides the emit method which is invoked everytime a logger method is triggered.
# --- Custom Logging Handler ---
class DBLogHandler(logging.Handler):
    def emit(self, record):
        log_entry = self.format(record)
        insert_log(
            level=record.levelname,
            message=log_entry,
            service=record.module,
            context={
                'filename': record.filename,
                'funcName': record.funcName,
                'lineno': record.lineno,
                'args': record.args
            }
        )
This code formats the log message (based on a formatter we have defined later) with this line: log_entry = self.format(record).
The insert_log method is called with the necessary information:
- level - DEBUG, INFO, WARNING, etc.
- message - the formatted log string with the log message.
- service - the name of the module where the log happened ( being fetched record.module which will return the python file name).
- context - details like filename, function name, line number, and any arguments passed in the original log message.
Finally, we get or create a logger named DBLogger and set the minimum log level to DEBUG (i.e., it will capture all log levels from DEBUG and above). The code creates an instance of DBLogHandler we just created above. Then we define a log formatter that formats messages to look like this: 2025-10-03 12:00:00 - INFO - Something happened. This happens in this line:
formatter = logging.Formatter('%(asctime)s - %(levelname)s - %(message)s') -Now, we apply this formatter to our db_handler to ensure that this formatting is maintained. Finally, we set this db_handler to the default logger by adding this as a handler.
Now that our log handler is ready with the default logging functionality overridden to write logs into our database, we will define a custom function, called log_by_input, which will take the numeric parameter input (provided by user on runtime) as a choice and do the following:
- First, it will populate a dictionary of log messages. This dictionary maps numeric choices to a set of strings.
- if choice in logs: - if the input choice exists in the dictionary keys (1–5), then:
- Get the log message by the choice number from the map above
- Next, we match the input choice (similar to switch-case) and based on the input choice, we call a logger function and pass the log message we fetched for the input choice. For example, if input choice is 1, then we invoke logger.info("This is an INFO log").
- Since our logger is already overridden as per our configuration, this invocation will finally lead to storing the data in the database (using the configuration that was setup using DBLogHandler).
Below is the full code snippet for the python script:
import logging
import sys
from db_logger import insert_log

# --- Custom Logging Handler ---
class DBLogHandler(logging.Handler):
    def emit(self, record):
        log_entry = self.format(record)
        insert_log(
            level=record.levelname,
            message=log_entry,
            service=record.module,
            context={
                'filename': record.filename,
                'funcName': record.funcName,
                'lineno': record.lineno,
                'args': record.args
            }
        )

# --- Configure Logging ---
logger = logging.getLogger('DBLogger')
logger.setLevel(logging.DEBUG)

# Add our DBLogHandler
db_handler = DBLogHandler()
formatter = logging.Formatter('%(asctime)s - %(levelname)s - %(message)s')
db_handler.setFormatter(formatter)
logger.addHandler(db_handler)

def log_by_input(choice: int):
    """
    Inserts a log entry based on the input number.
    """
    logs = {
        1: {
            "This is an INFO log"
        },
        2: {
            "This is an ERROR log"
        },
        3: {
            "This is a WARNING log"
        },
        4: {
            "This is a DEBUG log"
        },
        5: {
            "This is a CRITICAL log"
        },
    }

    if choice in logs:
        log_data = logs[choice]
        match choice:
            case 1:
                logger.info(log_data)
            case 2:
                logger.error(log_data)
            case 3:
                logger.warning(log_data)
            case 4:
                logger.debug(log_data)
            case 5:
                logger.critical(log_data)
            case _:
                print("Number not recognized")
    else:
        print(f"Invalid input: {choice}. Please use a number from 1 to {len(logs)}.")


if __name__ == "__main__":
    if len(sys.argv) != 2:
        print("Usage: python log_event.py <log_number>")
        print("Example: python log_event.py 1")
    else:
        try:
            input_number = int(sys.argv[1])
            log_by_input(input_number)
        except ValueError:
            print("Please provide a valid integer input.")
Note that in a real-time application, this will not be done using switch cases. We are using switch case to simplify and check all log levels from one python module.
Step 5: Executing the python module
Finally, we are all set to check our log messages being written into the PostgreSQL database. To execute the above file, we would need to run the following command from the terminal (opened from the folder containing the python scripts we created):
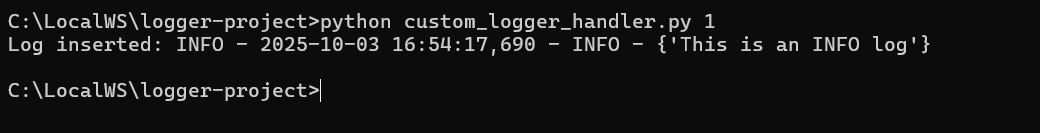
python custom_logger_handler.py 1
Once the above command is run, upon successful log operation, we should see the following message in our terminal:
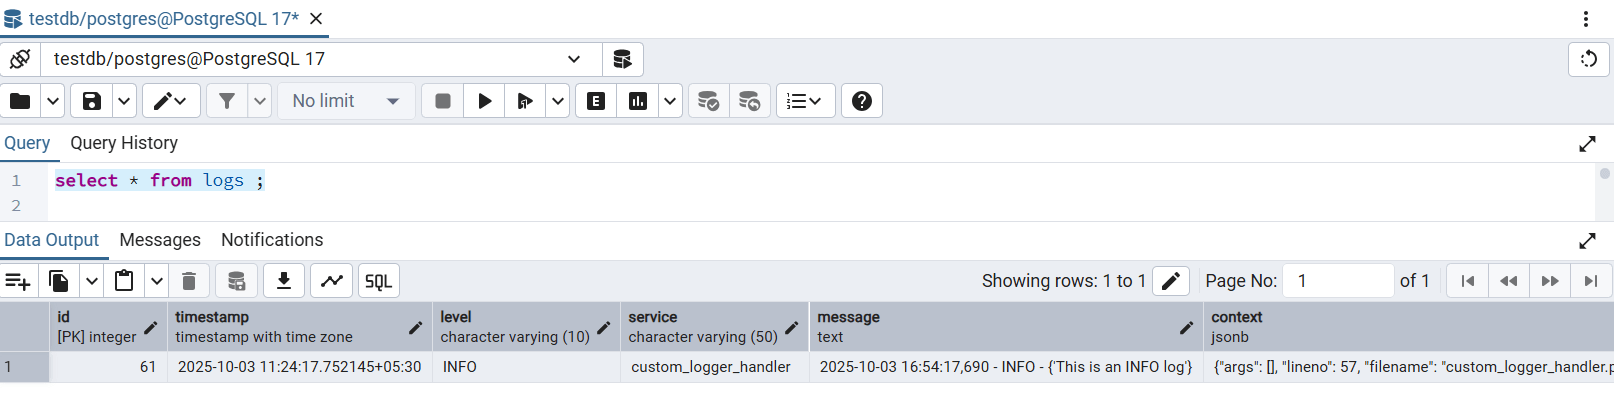
Now, let's head over to PgAdmin and check the logs table. We can see a row inserted below:
Now, we will run the same above command but with different parameters ranging from 1 to 5 multiple times to make multiple random log entries but with different log levels (just like it happens in a real time application). After that, when we query the database, we can see many records randomly created like this:
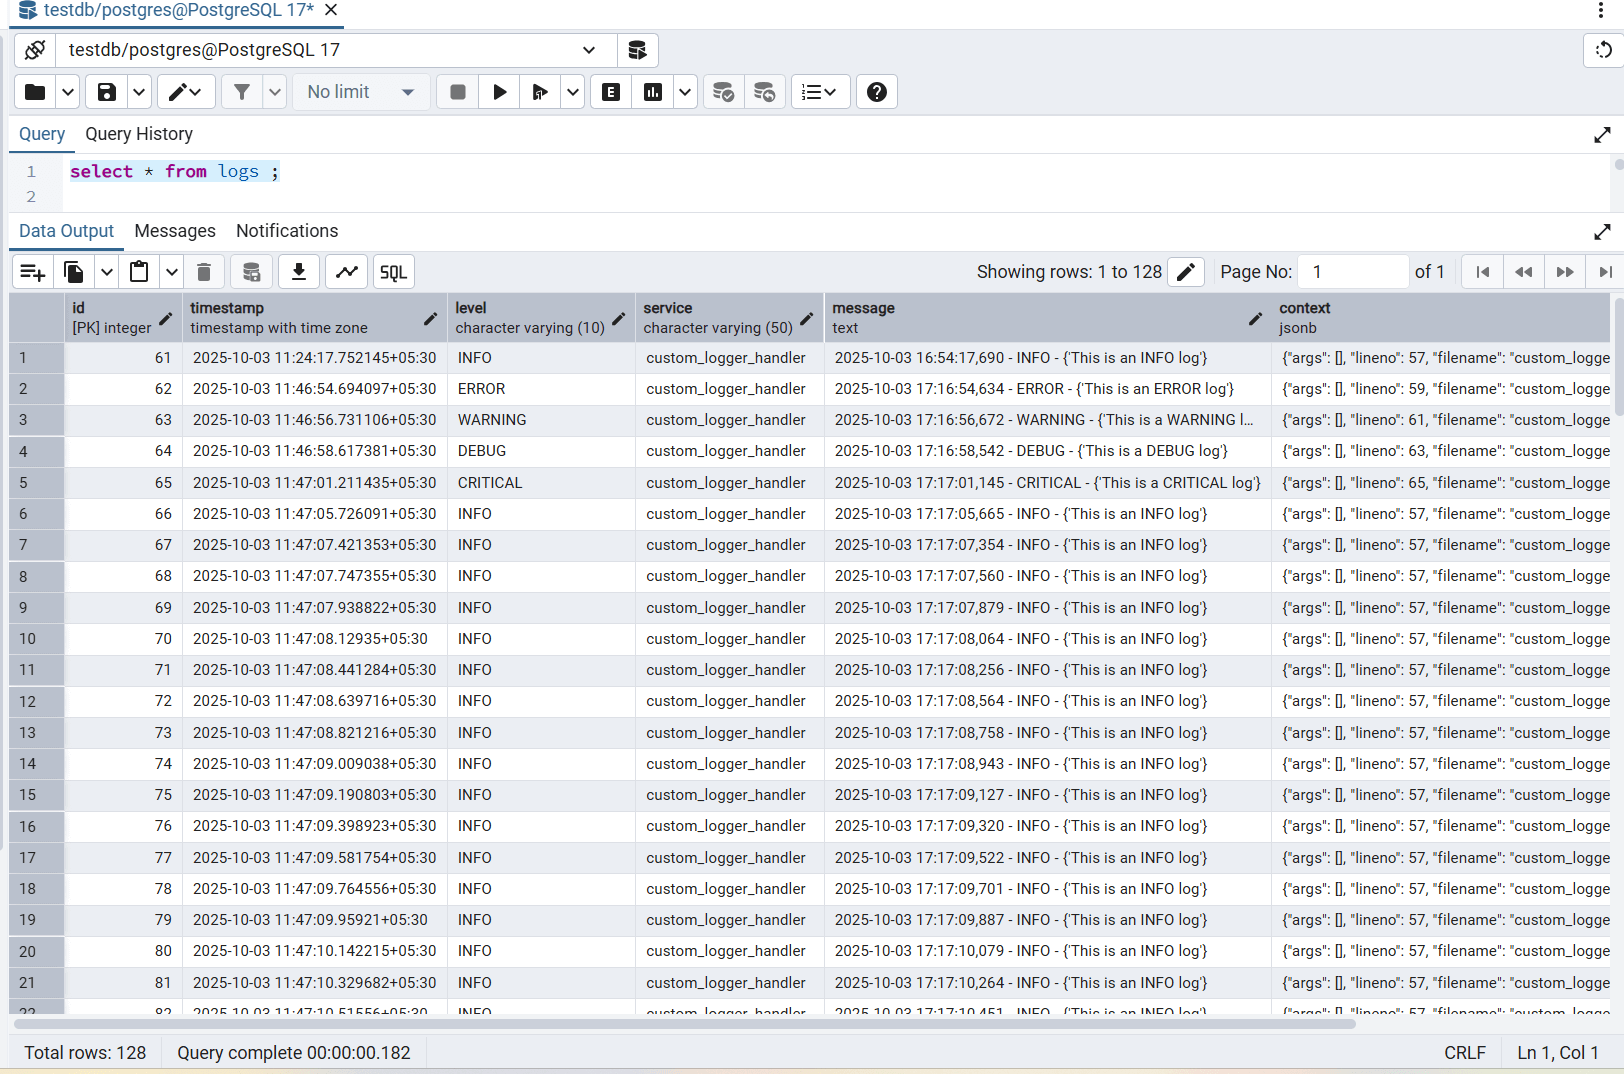
As we can see, there are total 128 records created. So every time from a python module a logger function is invoked, the entry of the log message will go to the database.
Step 6: Monitoring logs in real-time using Grafana
We will see how we can monitor logs using a 3rd party application like Grafana. To see this, we first need to install Grafana either locally or on docker. In this article, we will install Grafana on docker (or Rancher). To install Grafana on docker, run the following command:
docker run -d -p 3000:3000 --name=grafana grafana/grafana
This command will pull the Grafana image and install it on our docker system and start it on 3000 port number.
Once installed and run, we can head over to localhost:3000. The username will be admin and password will also be admin. These are the default credentials. Once we login, we can see the Grafana homepage.
Setting up PostgreSQL database on Grafana
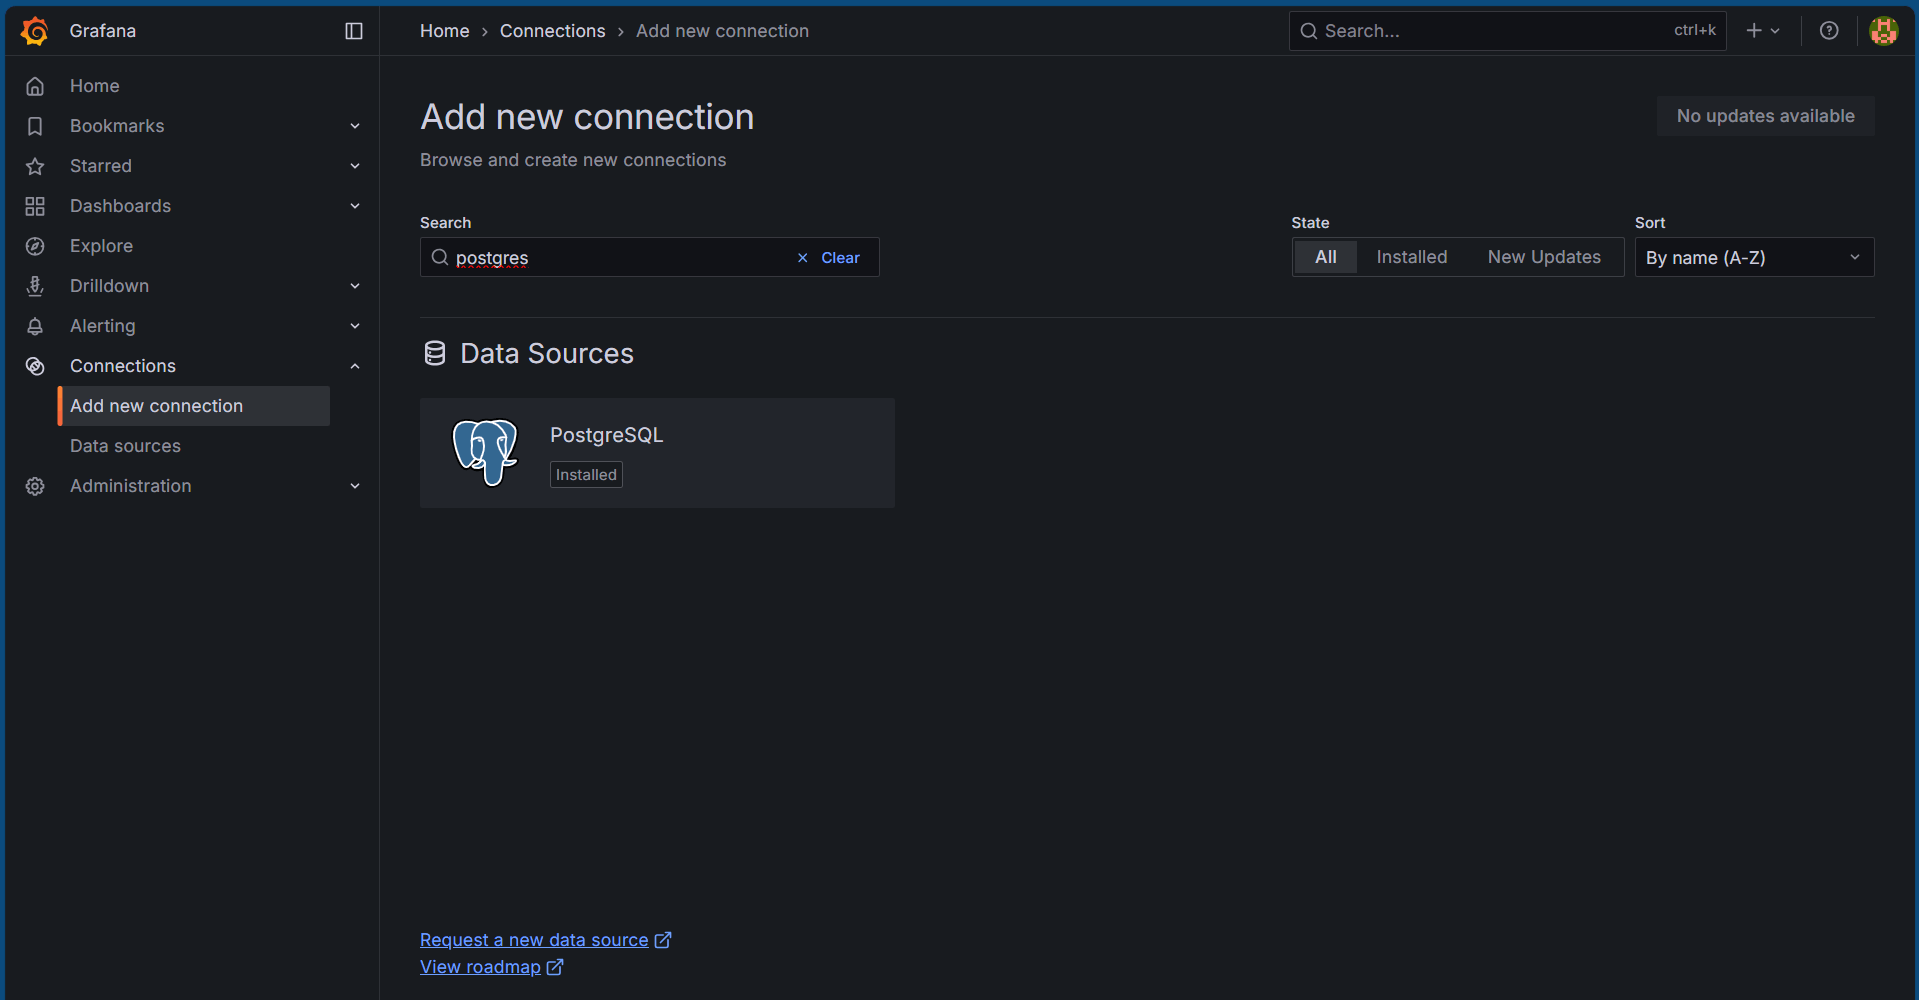
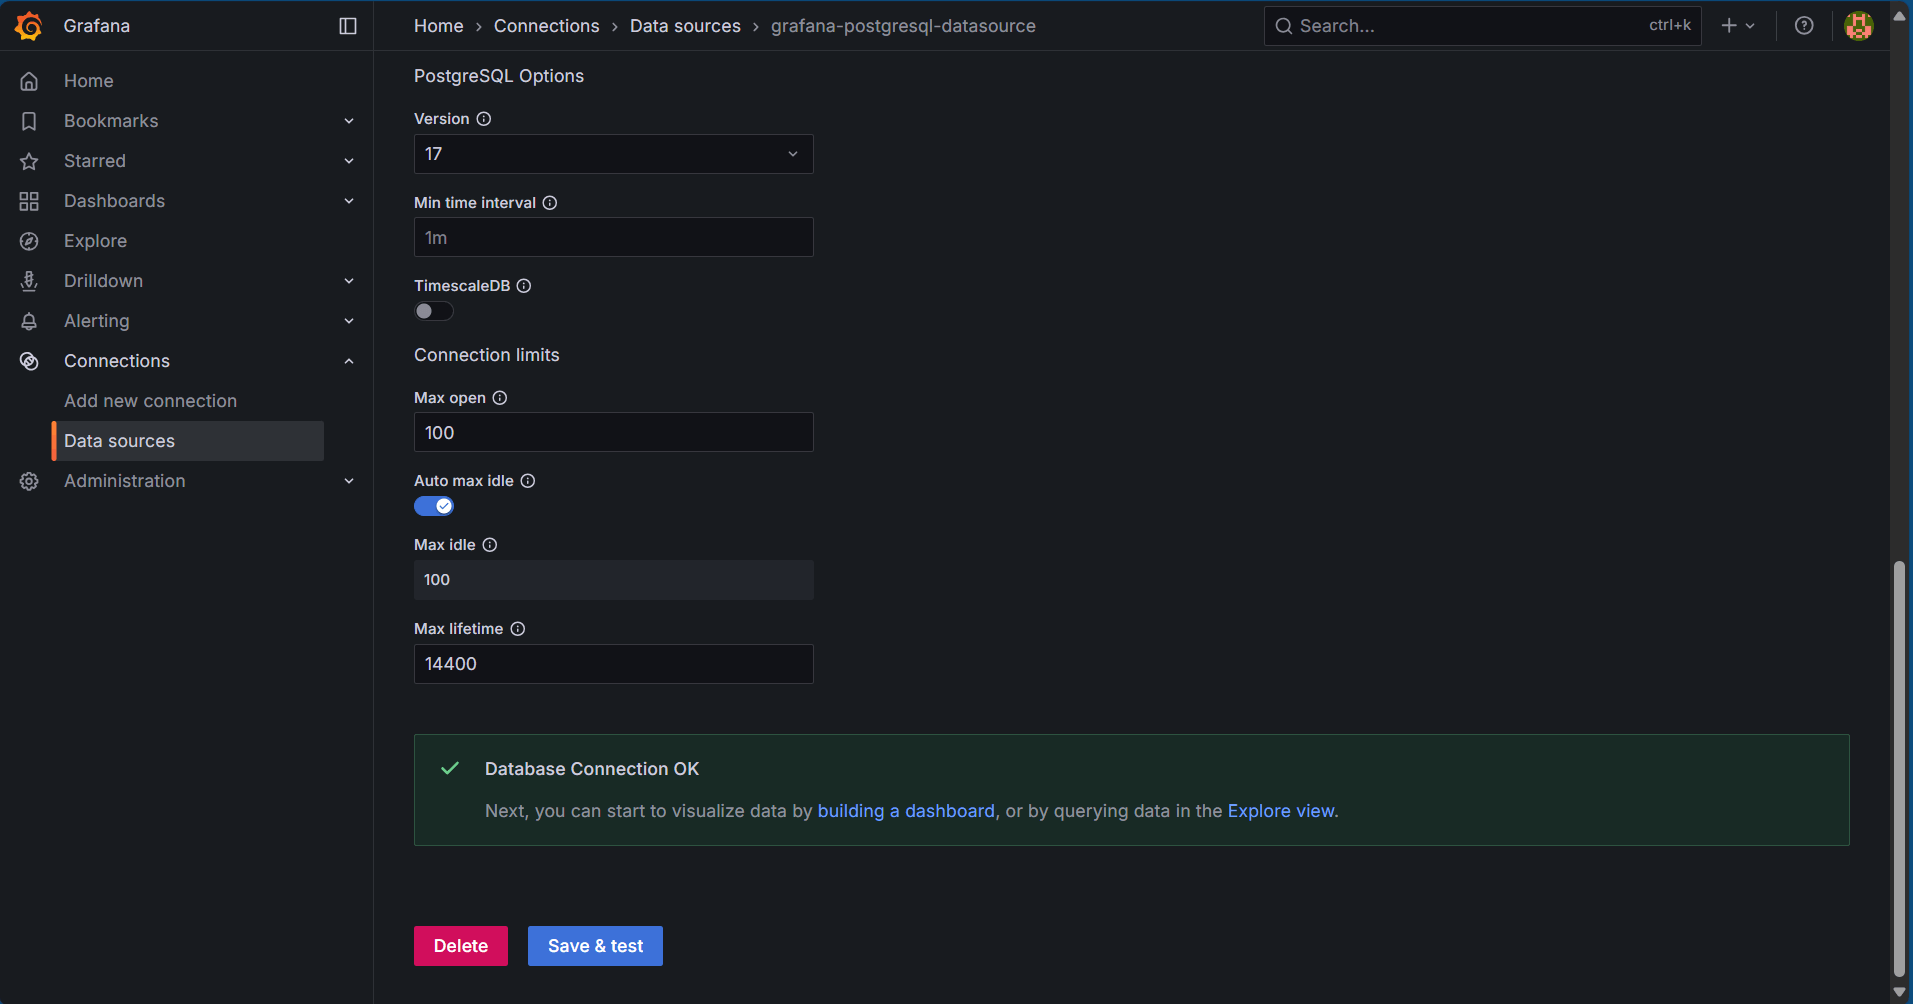
Next, we will need to link our local PostgreSQL database into Grafana to query the database tables and monitor in real time. To do so, we have to head over to Connections -> Add new connection. In the search box, type in postgres to search for the plugin as shown below:
After clicking on the PostgreSQL tile, click on Add new data source button on the right. This will open up a page to fill in the connection details. Fill in accordingly:
- Host URL: host.docker.internal:5432 (since we are running Grafana on docker. If installed locally, fill in localhost:5432)
- Database name: testdb (use your database name)
- Username: postgres (use your username)
- Password: ******** (use your password)
- TLS/SSL Mode: disabled
Click on the Save & test button to check your data source connection. If successful, we should see a following message:
Creating a dashboard for monitoring
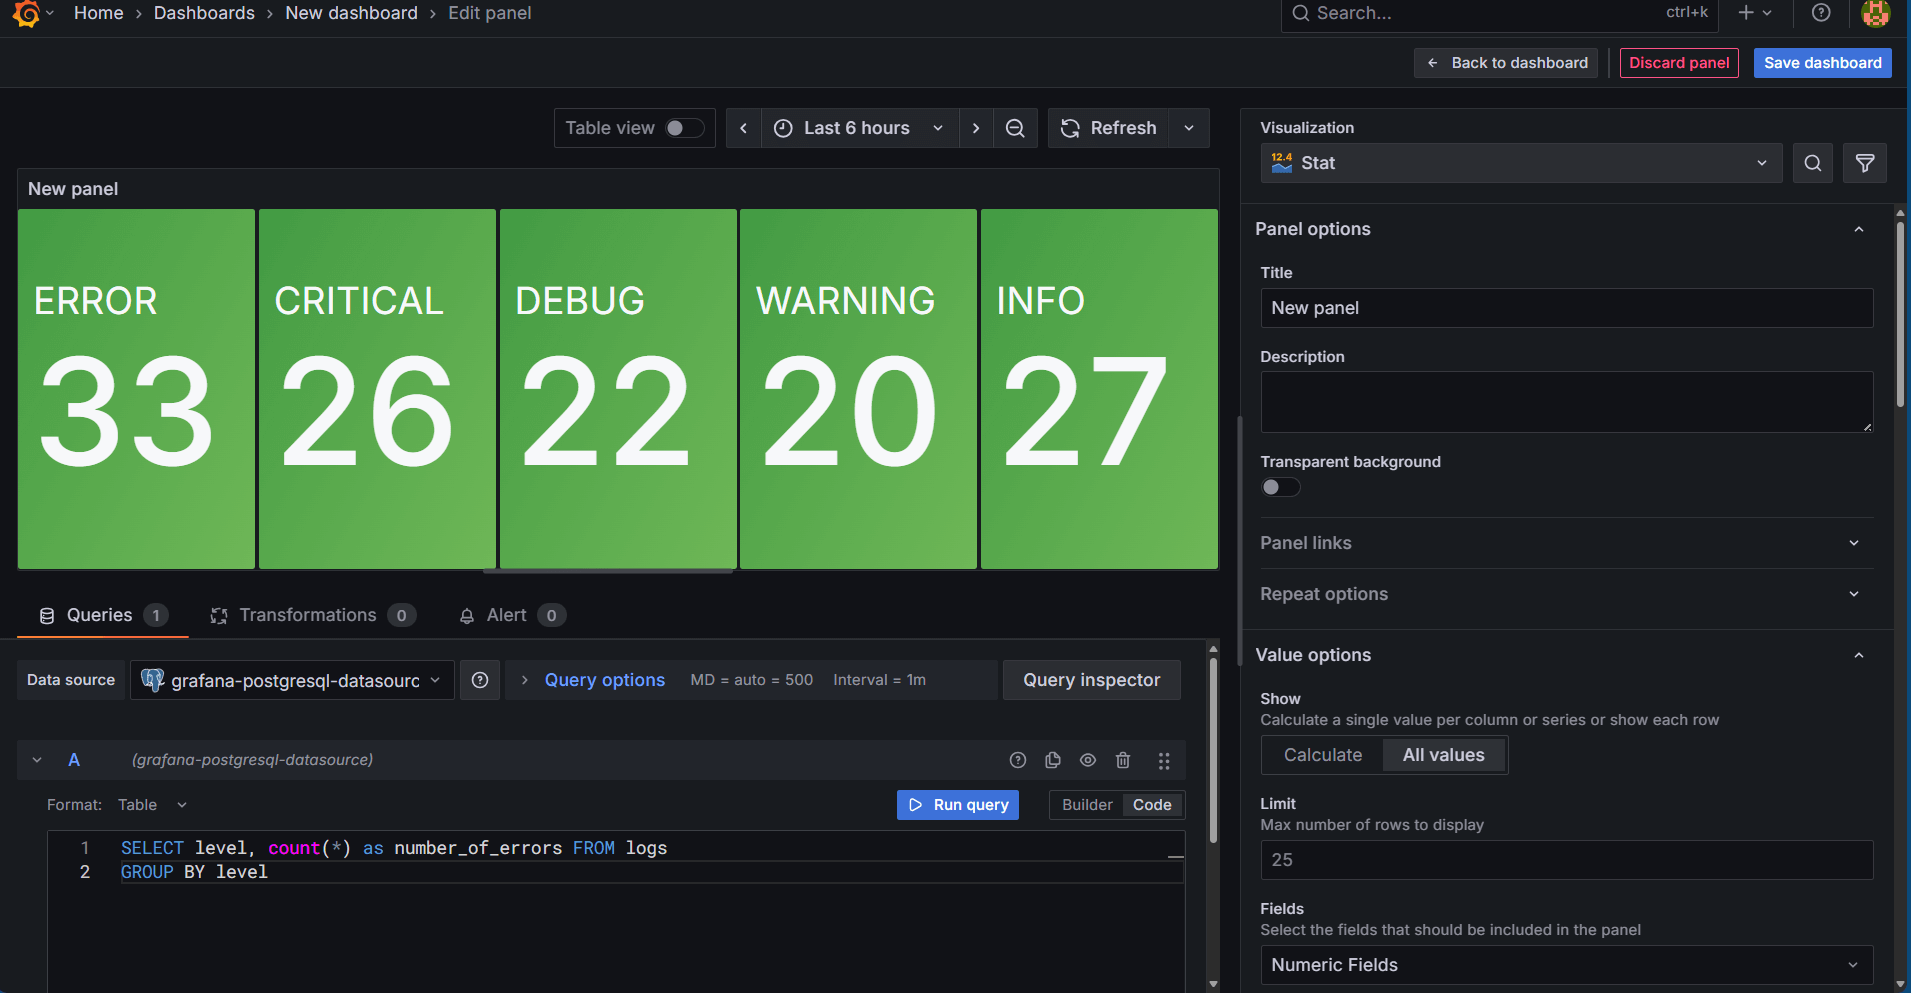
Next, with our data source configured as the locally installed PostgreSQL database, we will build a dashboard to monitor logs in real time. To do so, head over to Dashboards from the left-hand menu bar and click on Create dashboard. Click on Add Visualization and select the newly created data source. The following screen opens up:
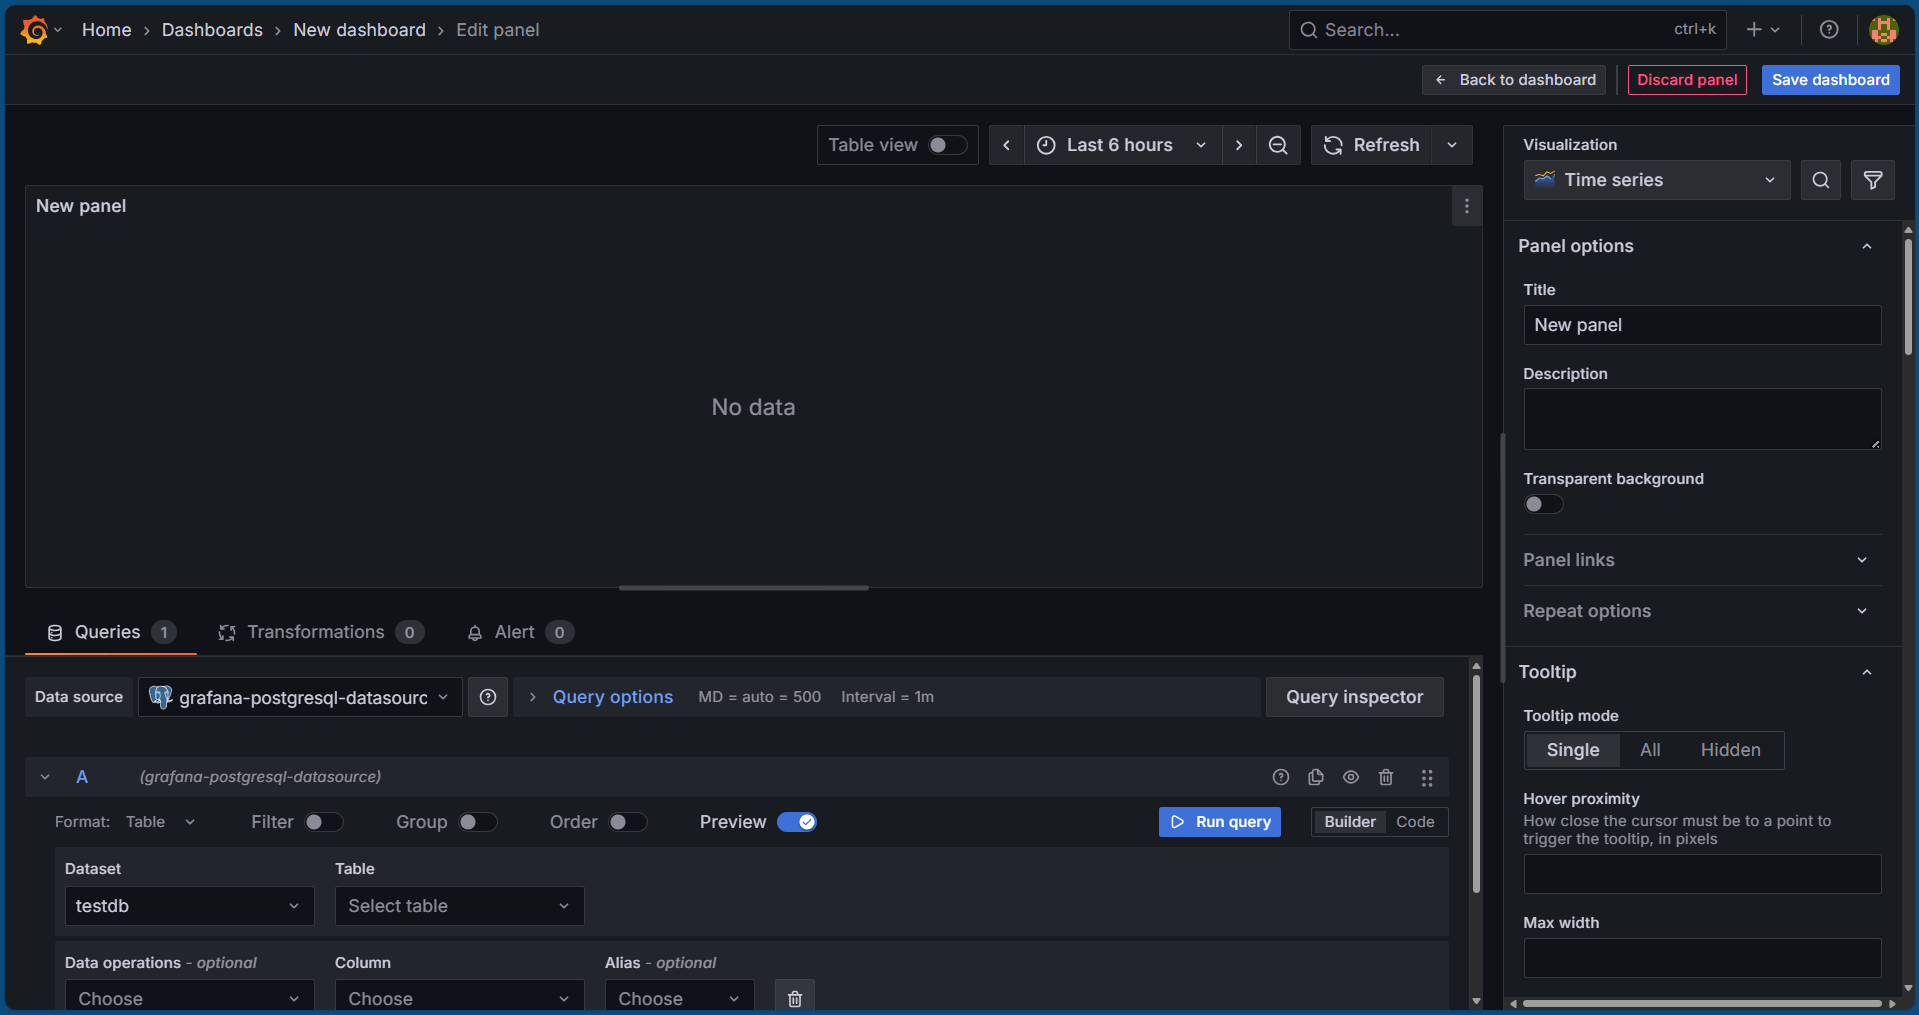
Now, select Code instead of Builder in the below section as shown in the image below:
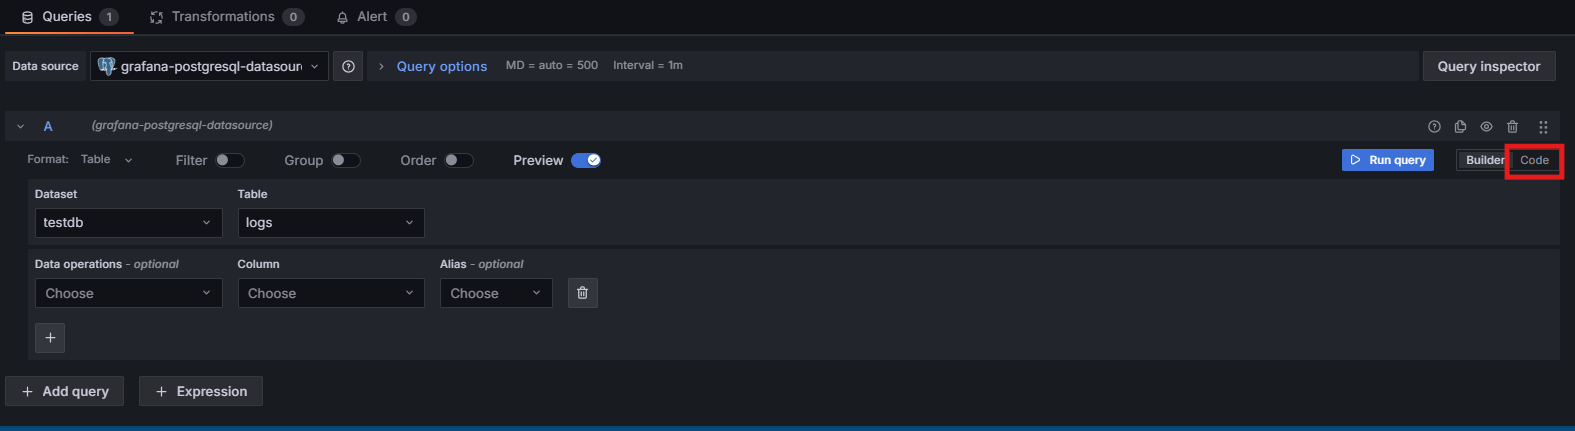
This will open the query editor to put in our query directly. We will use the following query to monitor our logs in real time:
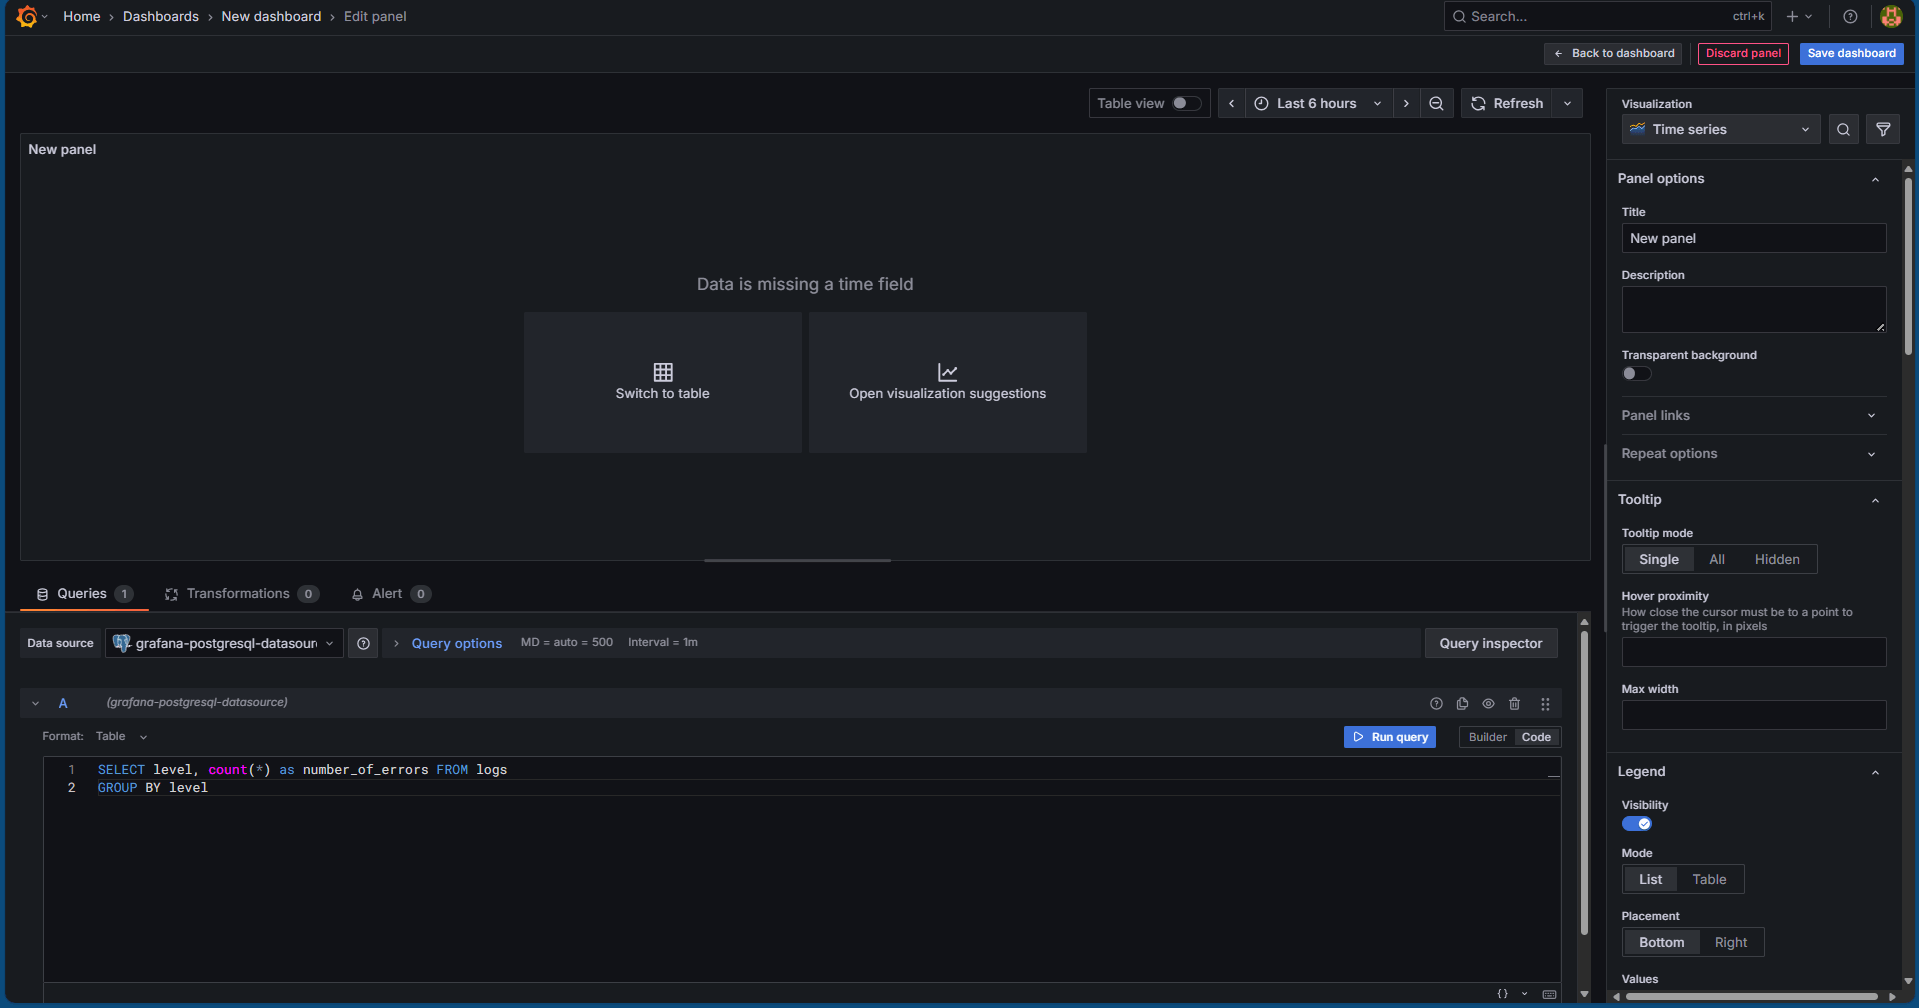
SELECT level, count(*) as number_of_errors FROM logs
GROUP BY level
Paste this query into the query editor and click on the Run Query button. You should see the following screen:
Click on Open Visualization Suggestions and we will see many suggestions of monitoring as follows:
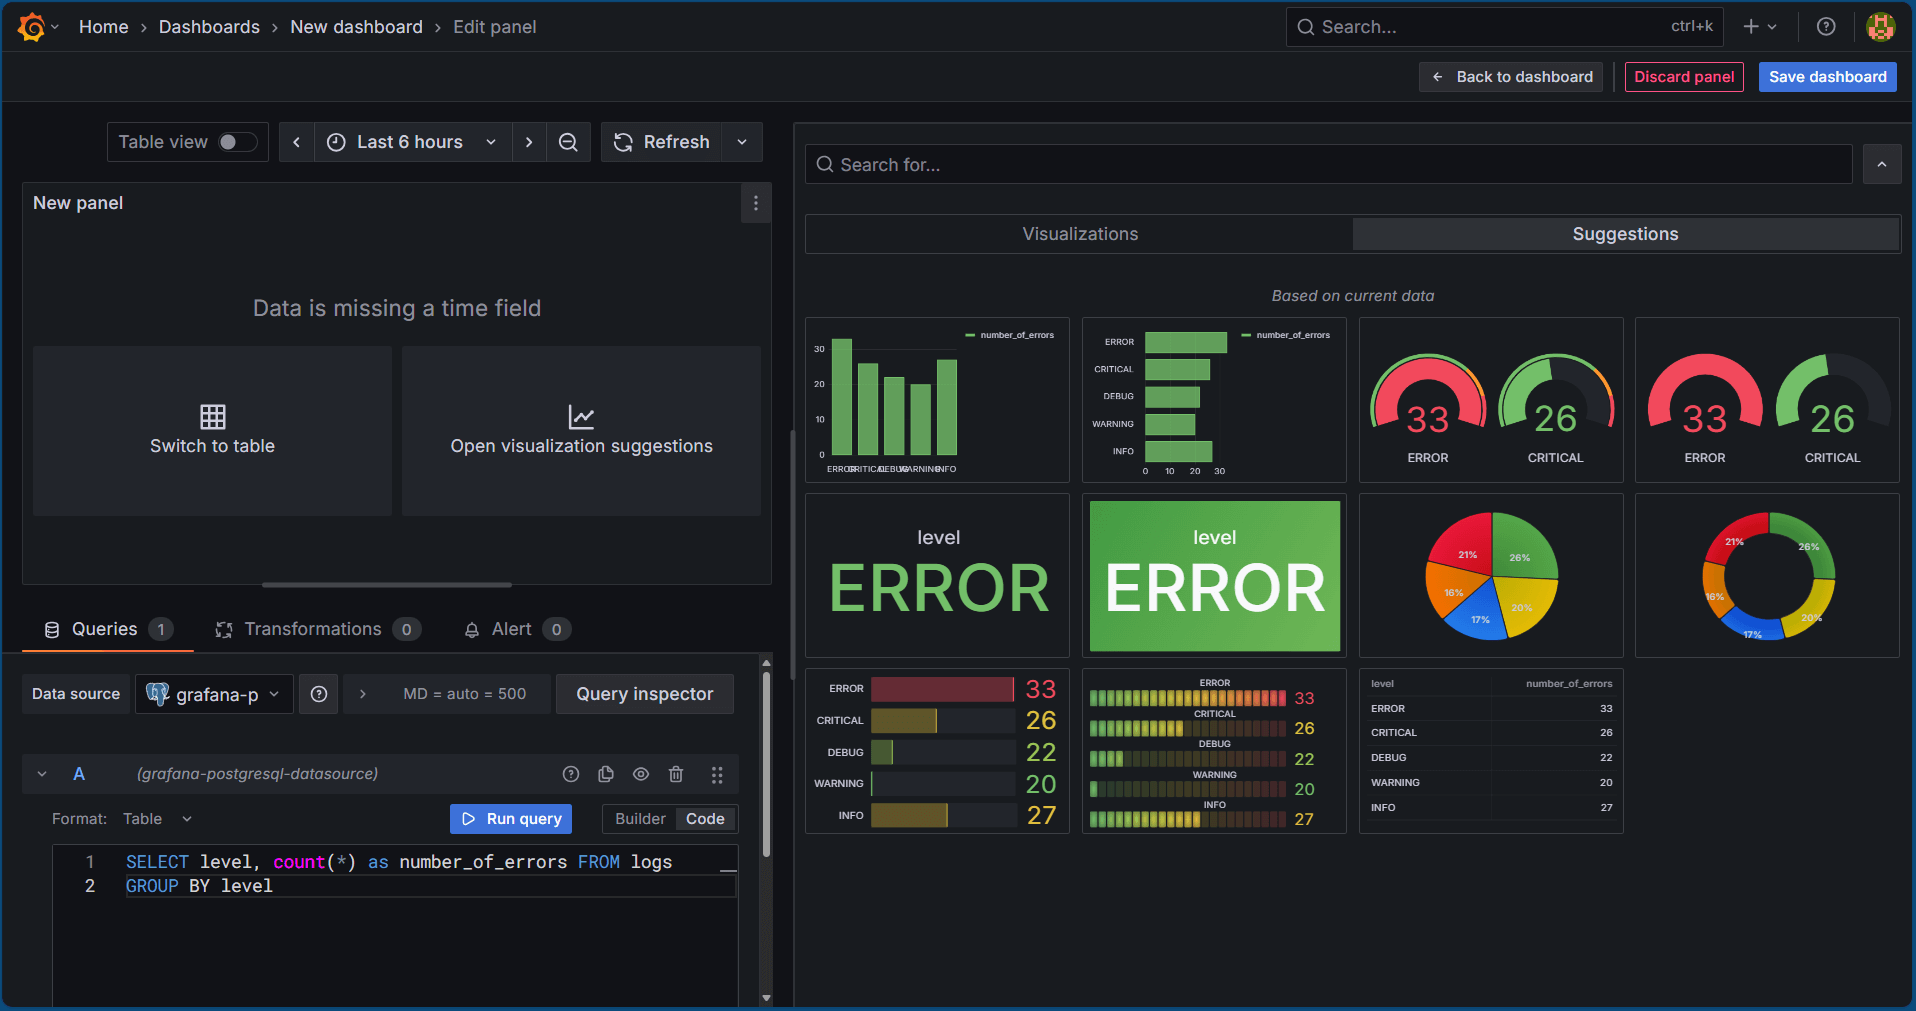
We can click on any one of them that suits our requirements. All we need to do is just click on the refresh button and if there are any more log entries generated, the same will start reflecting here.
Conclusion
We have learnt how we can customize the logger in python to actually connect to our database and make log entries into the database table for every logger functionality invoked which can help us in saving logs into the database and monitor them on need. When the logger functionalities will be invoked from different python modules in the real time application, the service name will also get changed and in that case, the use case will be even more useful and explanatory as new modules being rolled out to clients can be checked for their performance. We also learnt on how we can use Grafana to monitor database entries using simple queries in a dashboard form which can be very helpful for non-technical backend support teams to montior the application performance and report any unexpected error spikes in the application.