

Not too long ago I published an article describing a basic plan to use when optimizing existing or newly created queries. After a brief discussion with the publishers at
www.SQLServerCentral.Com to create a new series of articles, I have decided to visit this topic again and write a series of articles on optimizing and tuning Transact-SQL queries. The plan for this series is to start with the basics of execution plans, progress to advanced execution plan topics and finish up with articles on other methods used to optimize and tune stored procedures. You can review the brief query tuning plan article on my website at www.TransactSQL.Com to get a sense of the game plan for this series of articles. It is also my intention to write smaller articles to further explain any points of the larger monthly article that readers still have questions on. So send in any questions to me at Randy Dyess you may have about an article and I will either answer you directly or create a smaller article to answer your question.
Execution Plan Basics
I have always considered one of the easiest methods to tune a stored procedure was to simply study its execution plan. An execution plan is basically a road map that graphically or textually shows the data retrieval methods chosen by the SQL Server query optimizer for a stored procedure or ad-hoc query and is a very useful tool for a developer to understand the performance characteristics of a query or stored procedure since the plan is the one that SQL Server will place in its cache and use to execute the stored procedure or query. Most developers will grow to the point that it will be a simple matter for them to look at an execution plan and decide which step of a stored procedure is causing performance issues.
Execution plans can be viewed in either a graphical or textual format depending on the method used to obtain the execution plan. Query Analyzer and a small group of third-party tools, I personally use mssqlXpress, available at www.xpressapps.com; have the ability to turn the text-based plan into an easily viewed set of icons. From there is a simple matter of understanding the different icons and knowing how to drill down into the icon to retrieve detailed data.
If you do not use Query Analyzer or have a third party tool available, you can use Transact-SQL to display a text-based execution plan. Transact-SQL provides several commands to display execution plans, SET STATISTICS PROFILE, SET STATISTICS IO, SET STATISTICS TIME, SET SHOWPLAN_ALL and SET SHOWPLAN_TEXT. You can one or all of these commands to display a text-based execution plan with various degrees of detailed information associated with that plan.
Graphics-Based Execution Plans
Most developers prefer the graphic-based execution plans displayed by Query Analyzer or a third-party tool as they allow a quick glance to determine any major performance problems with a query. While the methods to retrieve the graphical execution plans vary by application, most of the icons used are very similar in functionality and appearance. The next few examples will show you how to return graphical execution plans with Query Analyzer. If you use a third party tool in your development, please see the help section for that tool on execution plans to see how to display a graphical execution plan.
Query Analyzer Graphical Execution Plans
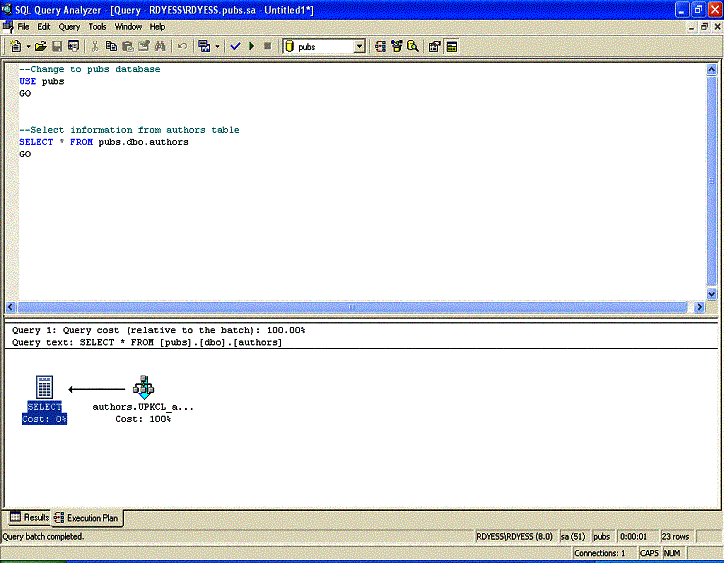
Once you have loaded your query or created a call to a stored procedure in the editor plane, click Query on the toolbar and then select Show Execution Plan. Execute the query and after the query has finished execution, select the Execution Plan tab to see the graphical execution plan output.
Example 1
Type in the following query, enable execution plans and then execute the query.

--Change to pubs database
USE pubs
GO

--Select information from authors table
SELECT * FROM pubs.dbo.authors
GO

Execution Plan Output
Query Analyzer Graphical Estimated Execution Plans
As you can see from the above example, Show Execution Plan will actually execute the query or stored procedure and output the execution plan used by the optimizer to a separate window. What if you did not want the query to actually execute but wanted to get a sense of what the optimizer is going to do? Query Analyzer allows you to simply show the estimated execution plan without actually running the query or stored procedure by using the Display Estimated Execution Plan tool.
A point to remember is that you cannot generate an estimated plan if your query contains temporary objects or references to objects the query builds, unless the objects already exist. You will have to build the temporary object or permanent object first and then obtain the estimated plan.
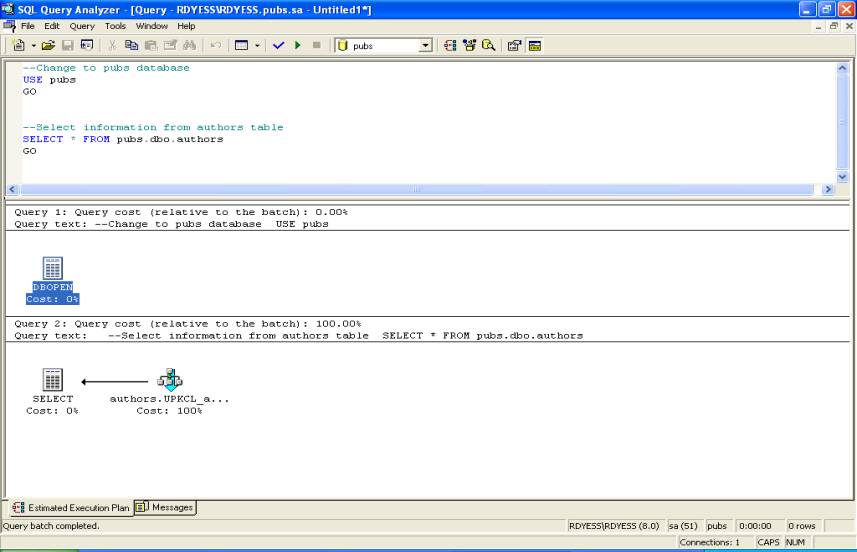
Once you have loaded your query or created a call to a stored procedure in the editor plane, click Query on the toolbar and then select Display Estimated Execution Plan. Execute the query and after the query has finished execution, select the Estimated Execution Plan tab to see the graphical execution plan output.
Example 2
Type in the following query, enable estimated execution plans and then execute the query.

--Change to pubs database
USE pubs
GO

--Select information from authors table
SELECT * FROM pubs.dbo.authors
GO

Estimated Execution Plan Output
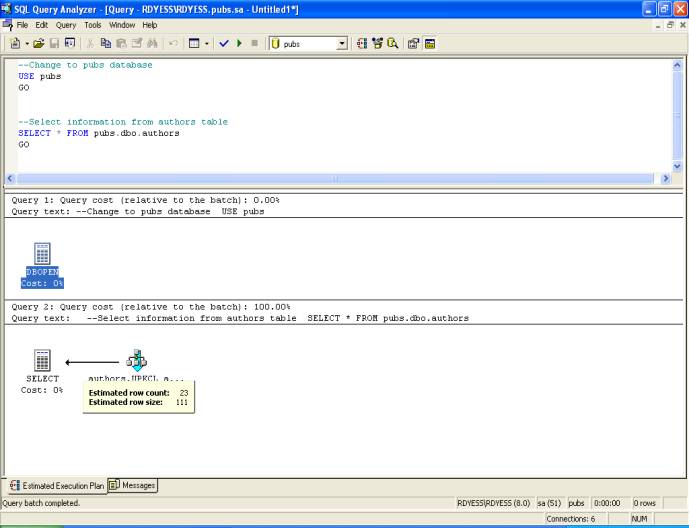
As you will notice from the outputs shown above the graphics-based plans do not seem to give you detailed information you may need to determine a problem. To obtain detailed information from each icon you just have to place the cursor over an icon to have the information displayed.

Or over a line connecting two icons.
Text-Based Execution Plans
If you do not have the ability to obtain a graphical execution plan, you can still use a series of Transact-SQL commands to retrieve an execution plan. While not as flashy for us visually orientated people, these Transact-SQL commands still provide a developer with a wealth of information to be used to find performance issues within a stored procedure or query.
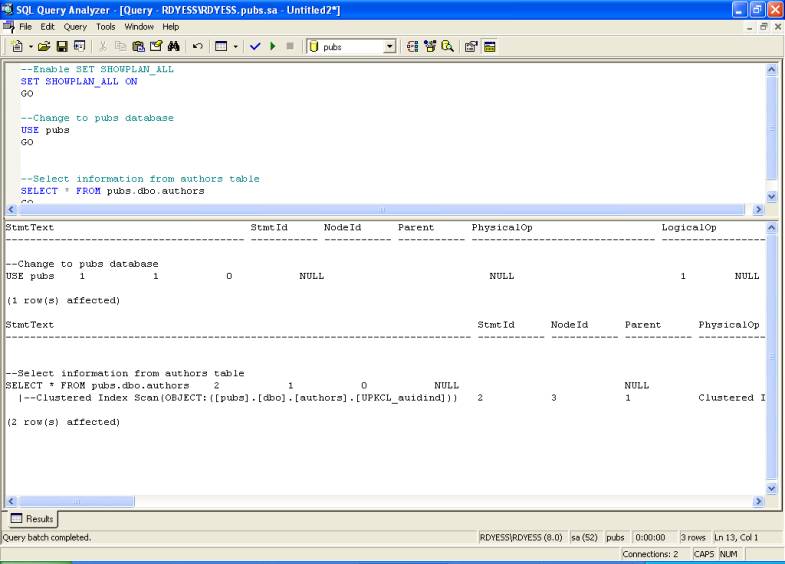
SET SHOWPLAN_ALL - SET SHOWPLAN_ALL will instruct SQL Server not to execute Transact-SQL statements but return detailed information about how the statements will be executed and provides estimates of the resource requirements for the statements.
Syntax
SET SHOWPLAN_ALL {ON | OFF}
Example 3 - Type and execute the following query.
--Enable SET SHOWPLAN_ALL
SET SHOWPLAN_ALL ON
GO

--Change to pubs database
USE pubs
GO

--Select information from authors table
SELECT * FROM pubs.dbo.authors
GO

SET SHOWPLAN_ALL Output
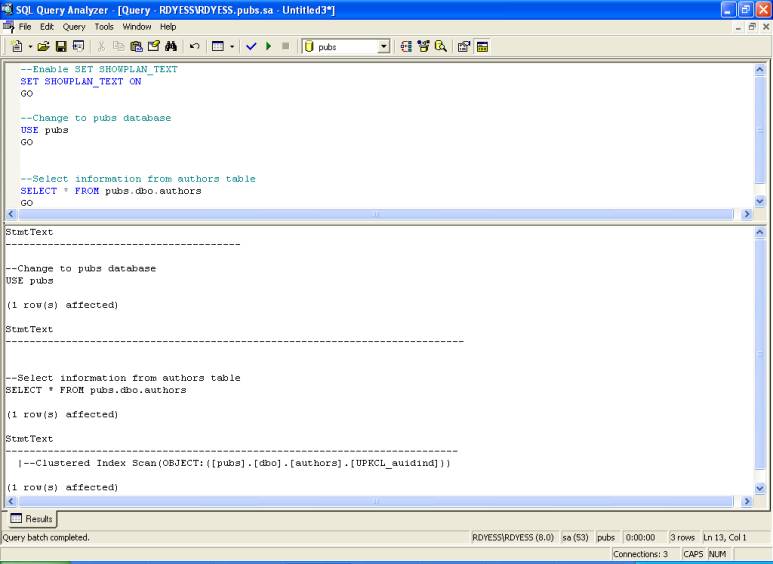
SET SHOWPLAN_TEXT -
SET SHOWPLAN_ TEXT will instruct SQL Server not to execute Transact-SQL statements but return detailed information about how the statements are executed.
Syntax
SET SHOWPLAN_TEXT {ON | OFF}
Example 4 - Type and execute the following query.
--Enable SET SHOWPLAN_TEXT
SET SHOWPLAN_TEXT ON
GO

--Change to pubs database
USE pubs
GO

--Select information from authors table
SELECT * FROM pubs.dbo.authors
GO

SET SHOWPLAN_TEXT Output
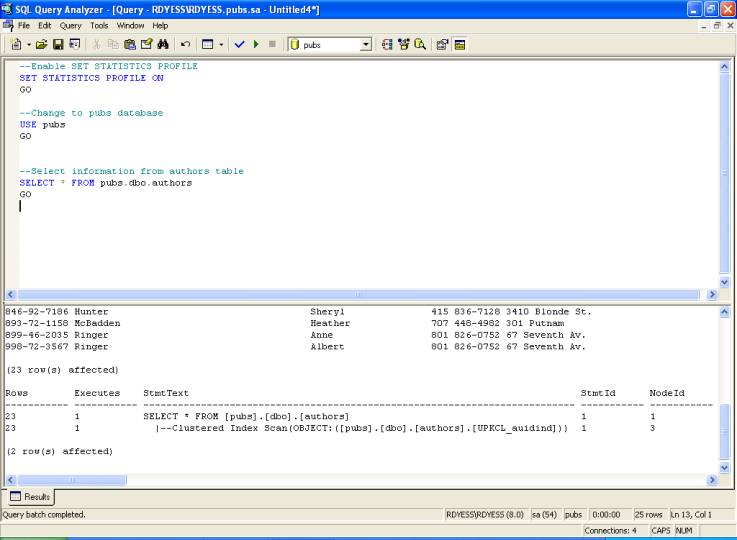
SET STATISTICS PROFILE
SET STATISTICS PROFILE instructs SQL Server to display the profile information for a statement after executing the statement.
Syntax
SET STATISTICS PROFILE {ON | OFF}

Example 5
Type and execute the following query.

--Enable SET STATISTICS PROFILE
SET STATISTICS PROFILE ON
GO

--Change to pubs database
USE pubs
GO

--Select information from authors table
SELECT * FROM pubs.dbo.authors
GO

SET STATISTICS PROFILE Output
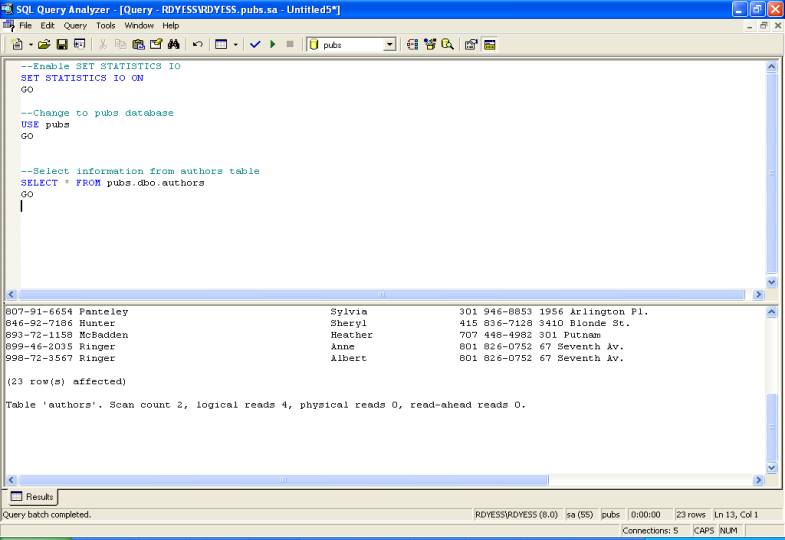
SET STATISTICS IO - SET STATISTICS IO instructs SQL Server to display information regarding the amount of disk activity generated by Transact-SQL statements after executing the statement.
Syntax
SET STATISTICS IO {ON | OFF}
Example 6 - Type and execute the following query.
--Enable SET STATISTICS IO
SET STATISTICS IO ON
GO

--Change to pubs database
USE pubs
GO

--Select information from authors table
SELECT * FROM pubs.dbo.authors
GO

SET STATISTICS IO Output
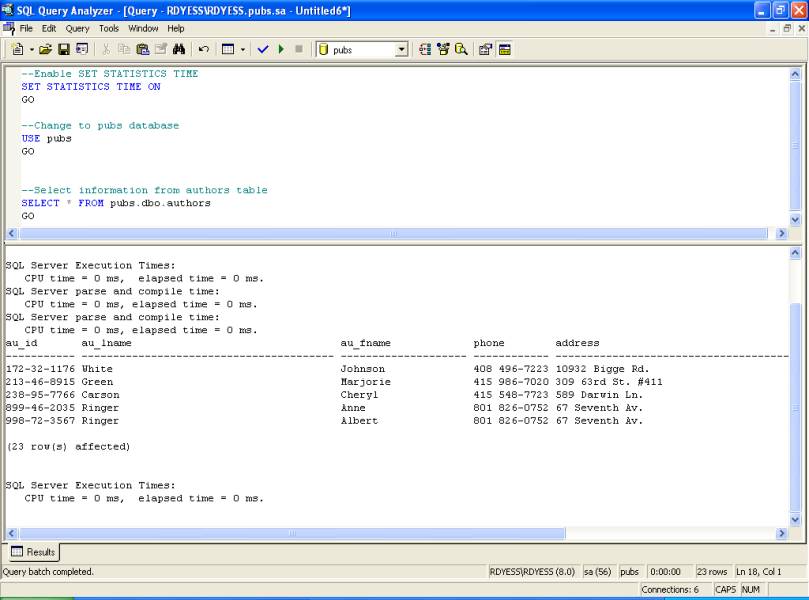
SET STATISTICS TIME
SET STATISTICS TIME instructs SQL Server to display the number of milliseconds required to parse, compile after executing each statement.
Syntax
SET STATISTICS TIME {ON | OFF}

Example 7
Type and execute the following query.

--Enable SET STATISTICS TIME
SET STATISTICS TIME ON
GO

--Change to pubs database
USE pubs
GO

--Select information from authors table
SELECT * FROM pubs.dbo.authors
GO

SET STATISTICS TIME Output
Now that we have gone over the basics for displaying an execution plan using Query Analyzer or Transact-SQL commands in this first article, the next article in the series will start you on the path to understanding the output of these execution plans by taking a closer look at the detailed information returned with an execution plan.