

Background
Our IT department recently made a change to a web-based survey that caused a stored procedure to execute about 150 times more often than usual. The change made the procedure fire every 6 seconds while the webpage was open instead of firing once on a webpage hyperlink click. This increased the daily execution count of this one particular procedure from 800-1,000 times per day to over 150,000 times per day.
The Issue
Once the change was made, a substantial amount of latching and blocking started showing up in the activity monitor. The wait statistic messages showing in the activity monitor are associated normally with parallelism in SQL Server and are shown in Figure 1-1 and 1-2:
Figure 1-1 Session running with parallelism waiting for exclusive latch
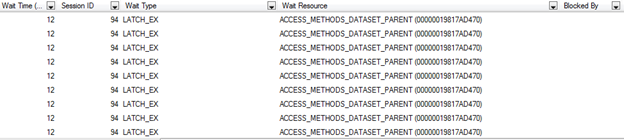
First, in Figure 1-1, I saw the LATCH_EX wait type with the ACCESS_METHODS_DATASET_PARENT wait resource. As Paul S. Randal mentions in an article about latches, this wait resource is "...used during parallel scans to give each thread a range of page IDs to scan." The LATCH_EX wait type occurs in this case because the session is trying to access an in-memory data structure that currently has an non-compatible latch mode on it. Since LATCH_EX is incompatible with the other latch already in place, this session has to wait until the operation is over before it can read from the data structure and move forward.
Figure 1-2 Session running with parallelism waiting for all threads to finish
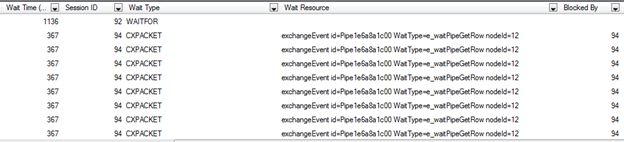
In Figure 1-2, we were also seeing CXPACKET waits, which are a result of multiple threads from one process waiting for a another thread to finish a task. This occurs when the multiple threads do not have identical amounts of work to do so some threads end up waiting on the others to finish in a parallel plan. A humorous analogy made by Tim Ford is a bunch of construction workers standing around a hole and watching one guy dig. All of the resources are tied up in the one task, but only one resource is doing anything because there is an uneven amount of work being done. This is evident by looking at the session ID of the CXPACKET rows and then looking at the session ID that is causing the blocking.
Our Investigation
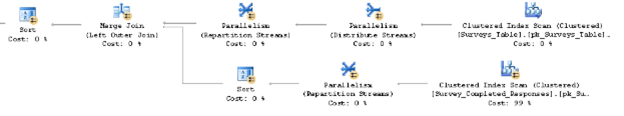
I executed the stored procedure to confirm it was executing at the same speed we were used to. It ran as expected and executed in a little under 2 seconds, so there did not appear to be anything different with the procedure. I opened the execution plan and found the procedure was doing clustered index scans using parallelism on a million row table. Each scan was taking 99% of the resources from the batch because we had no optimized index to cover this stored procedure. You can see the execution plan in Figure 2-1.
Figure 2-1 Execution plan using a Clustered Index Scan and parallelism
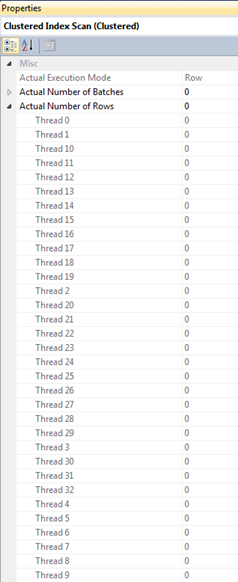
The properties of the parallel Clustered Index Scan using 99% of the batch resources indicated the query was using 32 threads to scan the table and not returning any results. SQL Server automatically spread the workload across multiple threads in an effort to return results faster. As a result, it assigned 32 threads to the plan since we had no specific setting set for MAXDOP on the query itself, no specific level of MAXDOP or Threshold for Parallelism at the server level (Figure 2-3), and no specific resource group. In Figure 2-2, we see the 32 different threads running along with a thread 0, that will aggregate and collect all the other threads.
Figure 2-2 Properties of Clustered Index Scan running 32 threads in Parallel
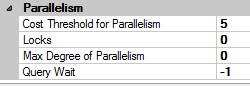
Settings about parallelism can be found in by right-clicking on your server instance in the object explorer and selecting Properties > Advanced. The properties are shown in Figure 2-3.
Figure 2-3 Server Instance Properties for Parallelism
I used sp_Help (sometimes defaulted as ALT+F1 shortcut in SSMS) and found the table only had a clustered index on an identity ID column without any additional non-clustered indexes designed for this procedure.
exec sp_help Survey_Completed_Responses
Since parallelism isn’t necessarily a bad thing, the query was fine at the time it was written for serving the purpose of being executed 800-1000 times daily. Once the environment changed and the procedure was now being executed every 6 seconds by potentially hundreds of concurrent sessions, it caused a problem.
Solution
The procedure code was filtering based on if the survey was completed, if it was a valid/active survey, and if a specific user took the survey on behalf of someone else.
SELECT Survey_ID
 FROM [Survey_Completed_Responses]
 WHERE [SurveyTakerID] = @Survey_Taker
 AND [SurveyTakenForID] = @Survey_User
 AND [Survey_Status] = 'Active'
 AND [Survey_Completed] = 'Completed'
I added an index that covered all the columns in the where clause and included the survey_id for the select statement.
CREATE NONCLUSTERED INDEX [ix_Survey_Completed_Responses_Covering]
 ON [dbo].[Survey_Completed_Responses] (
  [SurveyTakerID]
, [SurveyTakenForID]
, [Survey_Status]
, [Survey_Completed]
)
INCLUDE
(Survey_ID);
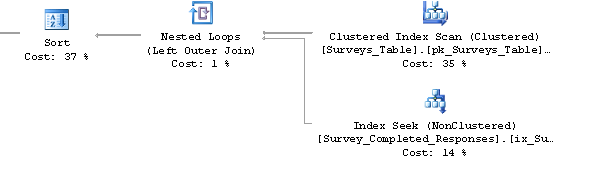
Once recompiled, all parallelism was removed from the execution plan and the latching and blocking essentially disappeared in a matter of minutes. The execution plan icons no longer had the yellow arrow icon indicating the plan was running in parallel and there were no more plan icons indicating parallel stream gathering or stream repartition.
Figure 3-1 Execution plan with covering index and no parallelism
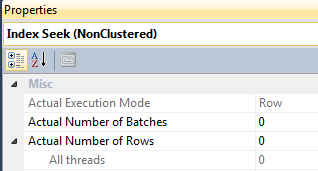
Checking the same properties as above in Figure 2-2 showed there was only 1 thread running the plan now instead of 32 threads.
Figure 3-2 Index Seek Properties
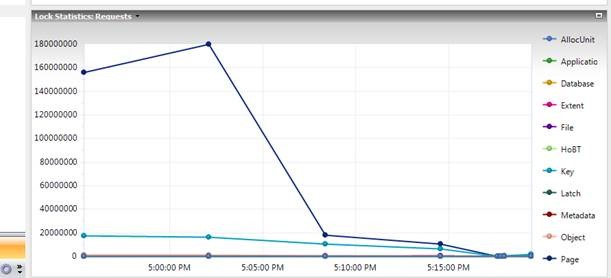
And finally, opening our performance monitoring software showed a dramatic decrease in the amount of latching we were seeing since we resolved the parallelism and waiting issues.
Figure 3-3 Decrease in Wait statistics after recompiling procedure with new index
An alternative method to adding another index would be to use a query hint in the procedure to force a specific MAXDOP of 1 to remove the parallelism, but that method is more masking the issue than addressing it. Without a covering index, the query would still be performing the large scans instead of seeking and performance would still suffer.
SELECT Survey_ID
 FROM [Survey_Completed_Responses]
 WHERE [SurveyTakerID] = @Survey_Taker
 AND  [SurveyTakenForID] = @Survey_User
 AND  [Survey_Status] = 'Active'
 AND  [Survey_Completed] = 'Completed'
 OPTION (MAXDOP 1)
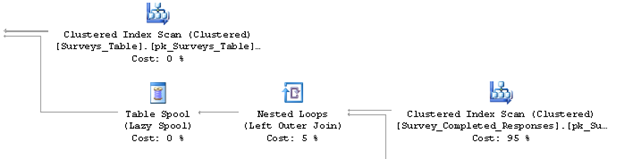
In figure 3-4, there is still a very high cost to the clustered index scan as opposed to the 14% cost from Figure 3-1 with the covering index. In addition, the plan is using a scan instead of efficiently seeking, causing more reads.
Figure 3-4 Original execution plan using Clustered Index and a MAXDOP of 1
Microsoft has published recommendations for MAXDOP that cover guidelines for how to determine best levels or parallelism at a server level. Other articles that are extremely helpful regarding parallelism and latching include:
- Understanding and Using Parallelism in SQL Server by Paul White
- My Query is (NOT) Waiting Because of Parallelism? by Tim Ford
- Parallel Execution Plans – Branches and Threads by Paul White
- Most Common latch classes and what they mean by Paul S. Randal
- Diagnosing and Resolving Latch Contention on SQL Server by Microsoft


