Like many of you that have been working with SQL Server for a decade, I find Extended Events to be cumbersome. The work to set up a session, the poor tooling, the delays in processing events, these all seem to make XE a worse choice than SQL Trace and Profiler. There's something about the immediate satisfaction of getting data streaming from a Profiler session that Extended Events hasn't seemed to duplicate well.
That being said, I know that XE is a much superior way of capturing the actions taking place inside of a SQL Server. It's very lightweight and far more granular in the type of information that you can gather. As I've been trying to learn more about XE and become more comfortable, I decided to try and move some trace sessions over to XE. There are different ways to do this, but in this article, I want to show how the quick setup of a new Profiler trace can be easily duplicated in Extended Events.
The Quick Trace
One of the things that I've seen no shortage of DBAs doing, including in the last year, is pop open Profiler and run a quick trace to see what's happening when there is a report of slowness on the SQL Server instance. This involved popping open Profiler, clicking the far left button, shown below:
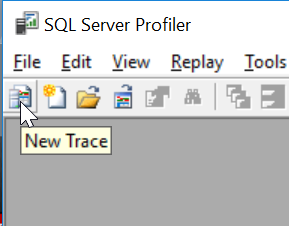
They then connect to their instance and get this screen, which many people just click "Run" on.
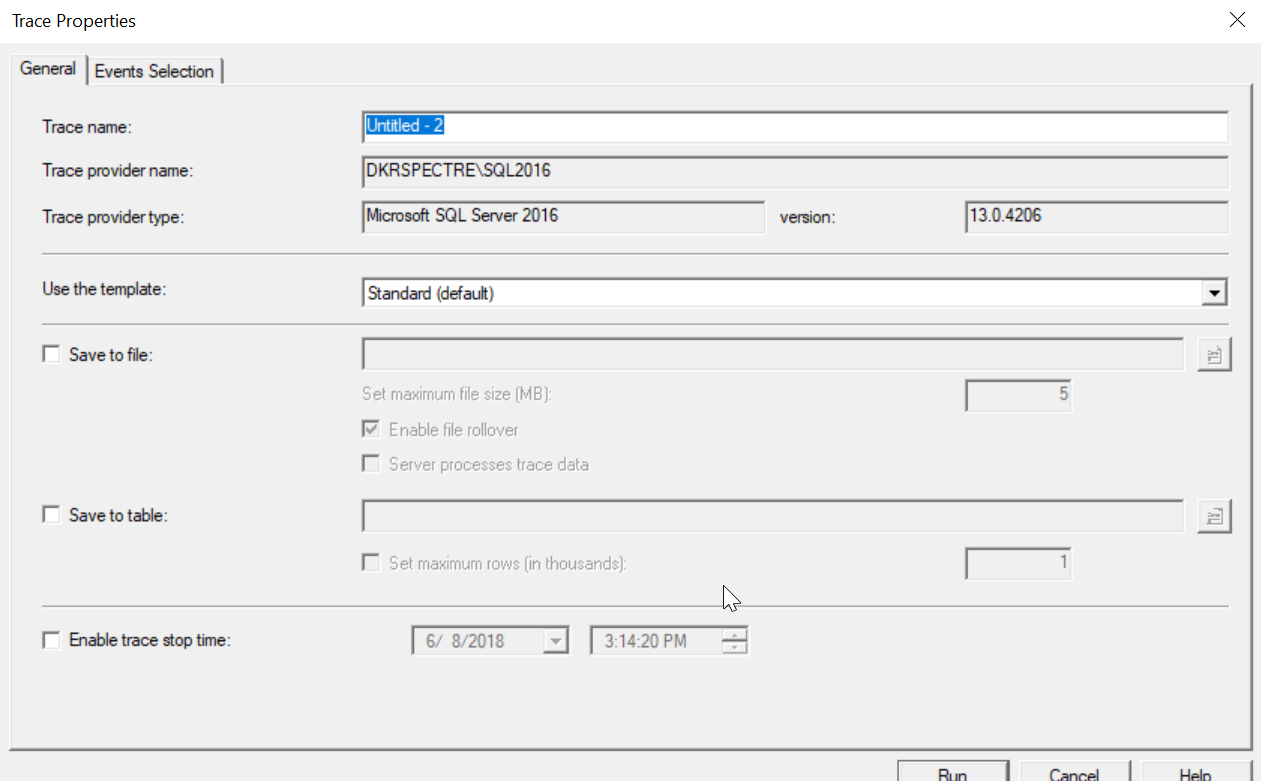
This creates an unnecessary load on the server, and in many newer versions, doesn't give you all the information you could get from the instance. Let's leave that aside.
Converting to XE
When I start this trace, it appears in sys.traces as an entry. I'll pause the trace to conserve resources, and then I'll go query sys.traces. Are you can see below, session 2 is my Profiler session. I didn't configure any storage or stop time, so some items are null. That's fine, what I want to do is use the information about this trace to set up an Extended Event session. It doesn't need to be running on the server all the time, but it will be saved as a session I can start when I think there are issues.
For the conversion, I'm going to use a script from sqlSkills Jonathan Kehayias. I've linked his blog in the Reference section below, which is where you can download the script.
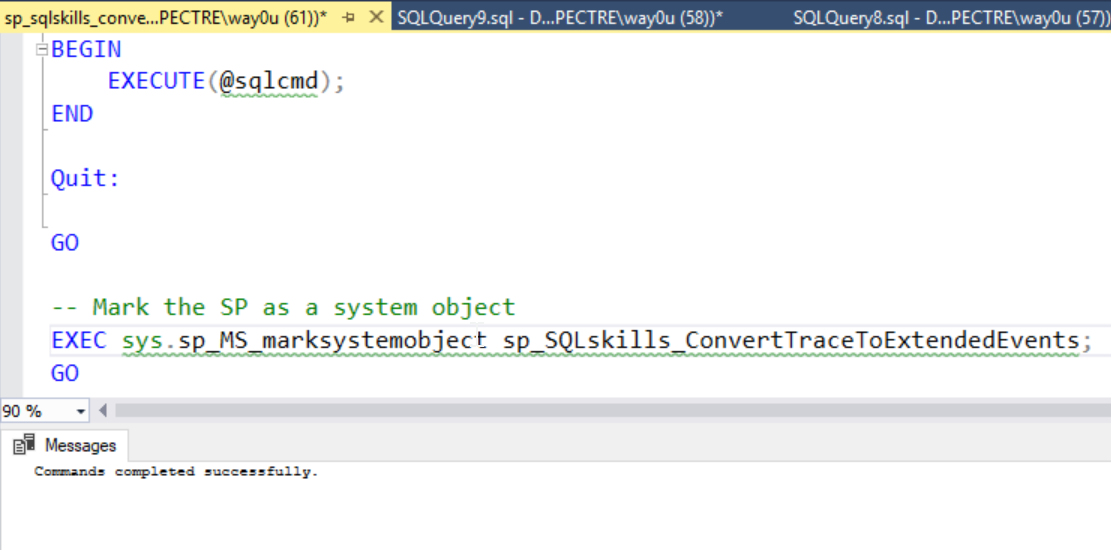
Once I have the script, I'll open this in SSMS and run it. One note, before you run this, there is test code at the bottom, so don't just run the script. Run everything before the test code to create a stored procedure to convert traces to XE sessions. You can see the end of his proc and the code that marks this as a system object below.
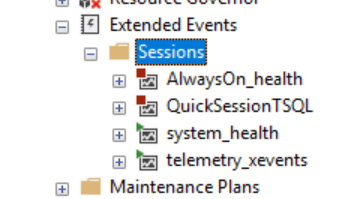
Before I run this, let's check the current sessions. As you can see, I have some default sessions and one that I created for examining the T-SQL being run on the instance.
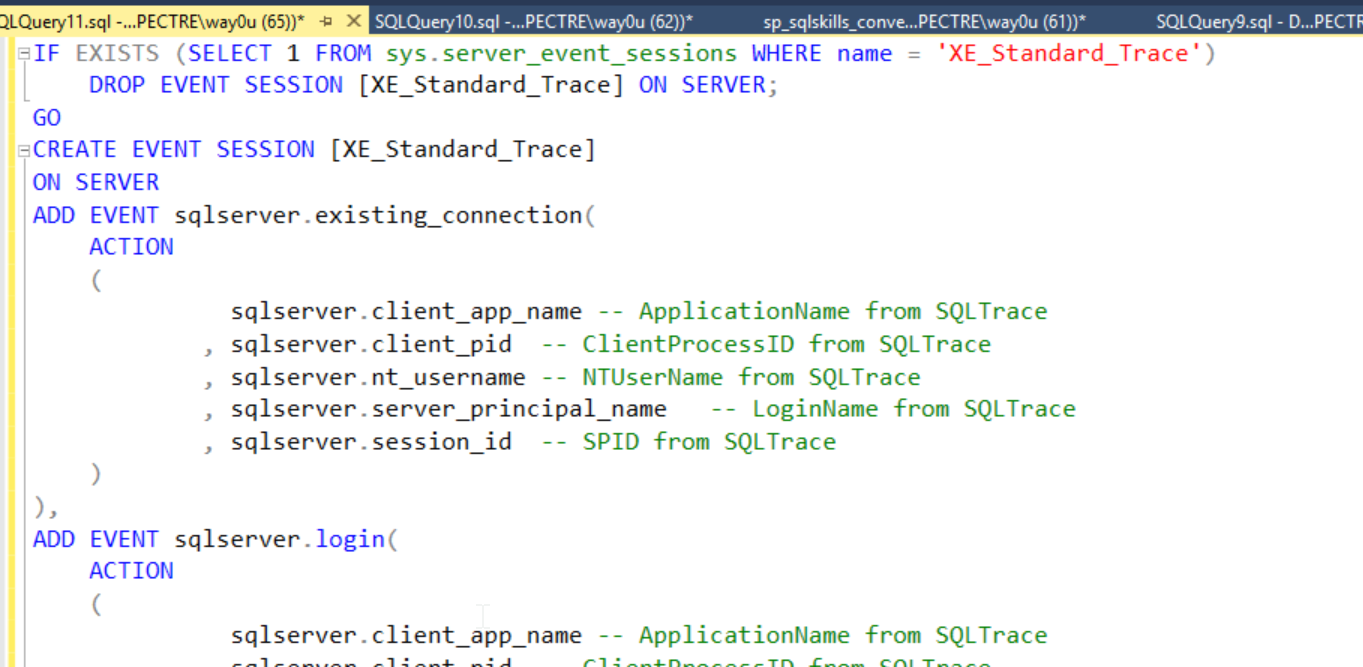
I'll execute the procedure, using the trace session 2 (still paused in Profiler) and giving this the name of XE_Standard_Trace. When I look at this, I see it's an XE version of the Standard trace template in Profiler.
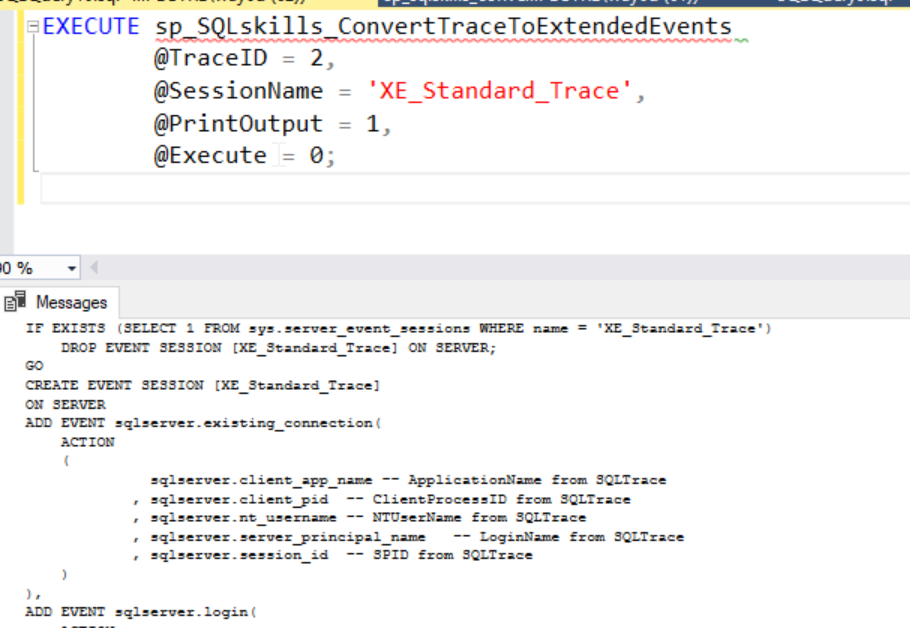
Once I have this output, I need to execute it. I'll select all the results and paste it into a new query window.
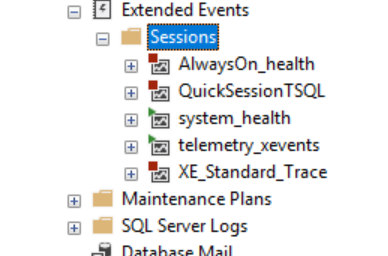
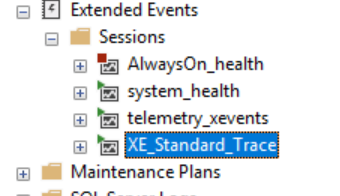
Once I do execute this code, I'll see a new session. This session is off by default, but I can start it anytime, just like Profiler.
Using the Session
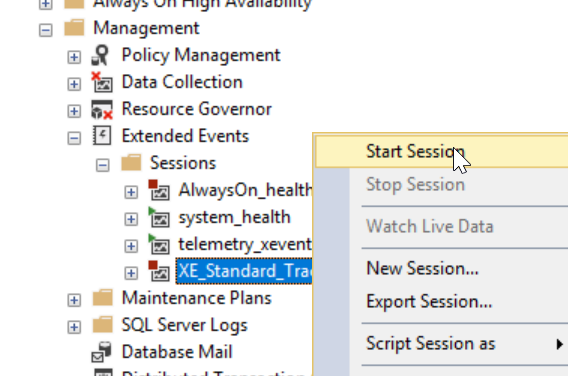
Let's see how quickly this works. Assume I have an issue on my system. Instead of running Profiler, I expand out the Extended Events folder and then Sesisons. I right click on XE_Standard_Trace and select Start. I almost always have SSMS open, so this is quick. It's a couple clicks, but I'm running.
To be fair, this is a few clicks for me. I need to click to open the Management, Extended Events, and Sessions folders (3) and then right click the session. Not as quick as Profiler, but not that bad.
Once it's running, I see the green added to the icon.
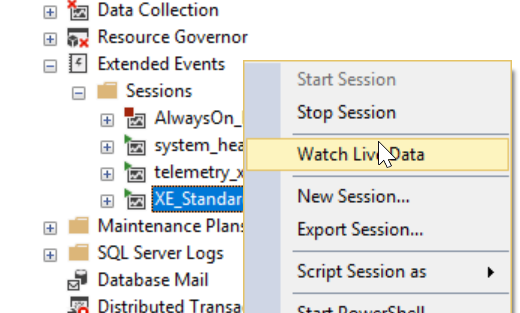
Now I need to view the data, so I'll right click the session again and select View Live Data.
Immediately I see the pane open with the activity on my instance. I can look through and watch to see which items are occurring. I have a load running, but when the data pane opens, I see this image, which isn't that useful. There's not enoug data here.
This is the default, but I can change this. Under the Extended Events menu, there's an option to choose the data I want to see. I've selected this in the image below.
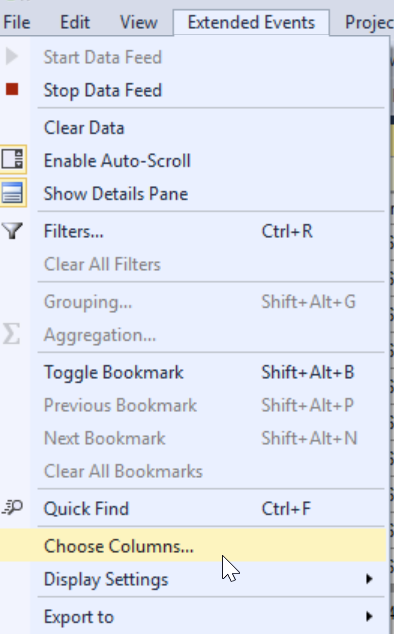
Once I click this, I get a moved dialog where I can pick and choose columns, reorder them, and alter my display. I've added a few items here, but you can pick whichevery ones you want.
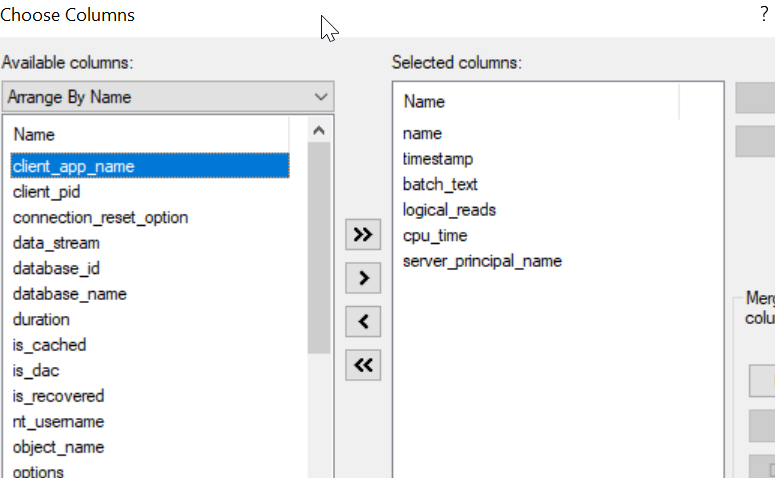
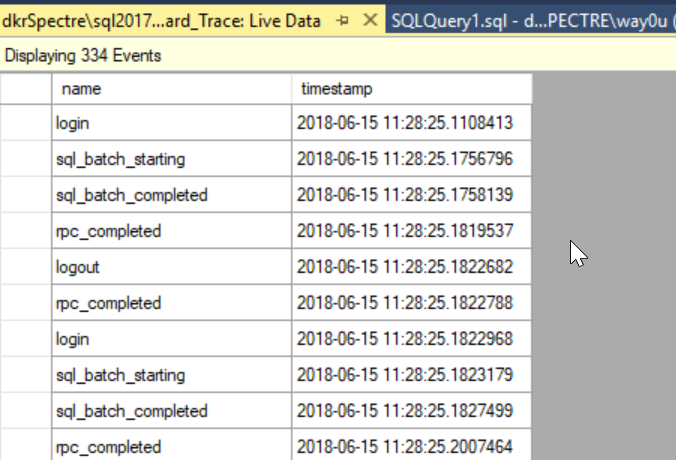
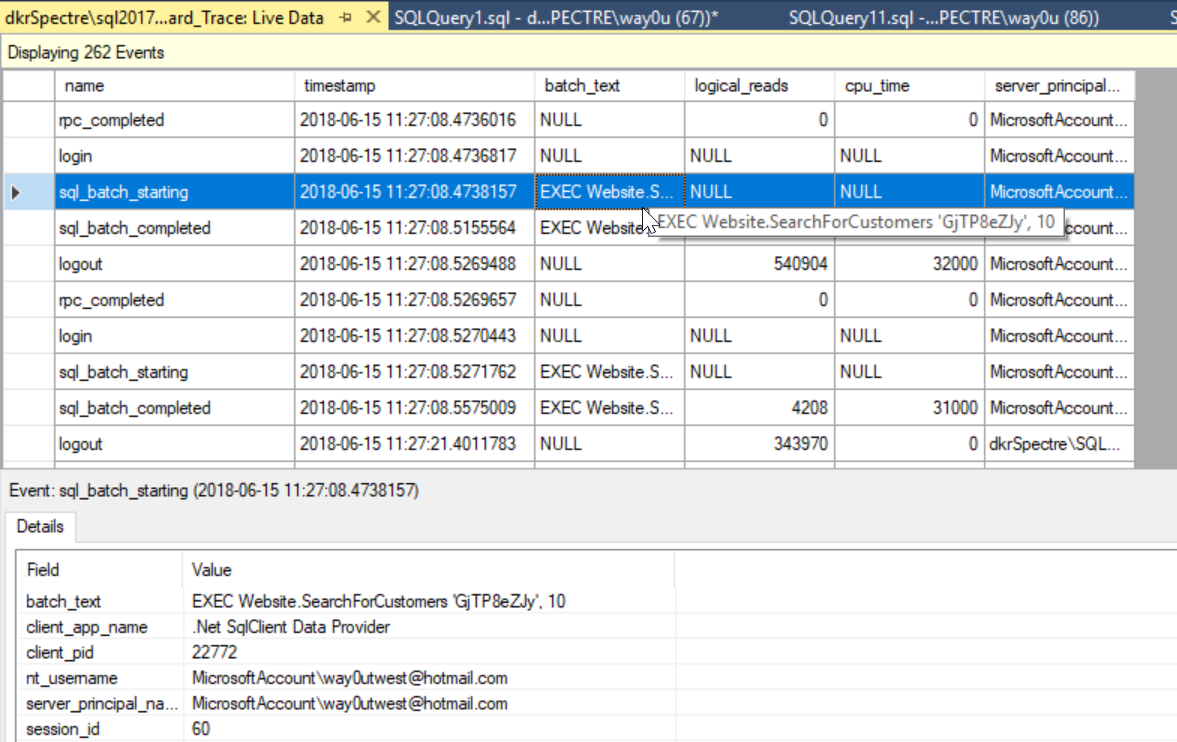
Once I click OK, I see this display. Note, it's being refreshed as events are added. My load test shows a few batch starting and completed items.
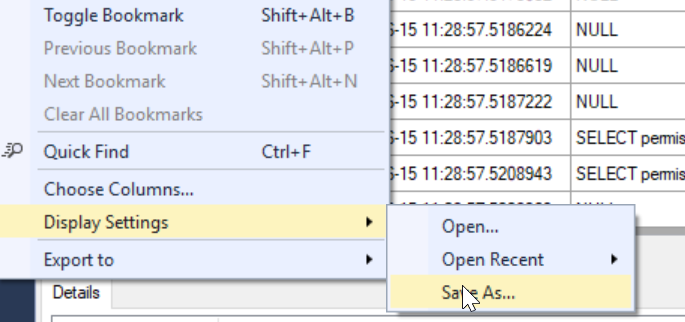
I want to save this display and use it the next time I open the XE session, so in the Extended Events menu, I choose "Display Settings" and "Save As".
I give this a name, but that's not important for now. If I start this session later and watch data on this machine, I get the same display. Or I can have a set of display settings and open any of them in a session.
Using PowerShell
One quick note here. If you're like to convert your traces using PowerShell instead, Chrissy LeMaire added a note in the discussion that uses ConvertTo-DbaXESession to build your XE sessions.
Conclusion
Jonathan has written a great procedure to help you convert your traces to XE. It's useful, handy, and you ought to use it now and save the sessions or load them onto the instances that you used to run Profiler against.
Is it as easy as Profiler? We could argue, but I'll agree this isn't quite as simple and easy as Profiler the first time. The second and later, yes, it's close. A few more clicks, and I might need to reload the display, but I get the data, and this is more cutomizable, and more importantly the sessions are on the instance, so anyone connecting to them can see the data.
Is this useful? More so. I could set limits and filters in XE that are more granular and flexible than those in Profiler. I create less load on already busy systems, and I can have the data saved automatically. That's something I've forgotten to do more than a few times in Profiler.
Is it less helpful? A little. The display options aren't useful by default, nor are they stored with the session. They're with SSMS. Overall, this is a bit of a disconnected system that is more flexible, but also a higher bar to get moving.
I think the move to XE is hard. It's a mindset, and every new instance is a hassle. However, a bag of tricks is something every good DBA needs, and saving a few of these session scripts is a helpful addition to your toolbelt.