

Ground Rules
This article shows 10 things which Microsoft got oh-so-right in SQL Server Reporting Services 2008 R2 (hereafter called SSRS). First, a few ground rules:
- The article compares SSRS 2008 R2 with version 2005, its natural parent.
- The article concentrates on SSRS from the report designer's perspective (so if you're hoping for lots of excited comments about Azure and cloud computing, you'll be disappointed).
- The article is aimed at people who either want to know what SSRS can do, or who are considering upgrading to 2008 R2.
This is the first of a two-part series: you may also want to look at the article entitled 10 Bad Things About Reporting Services 2008 R2.
Good Thing 1 - Indicators
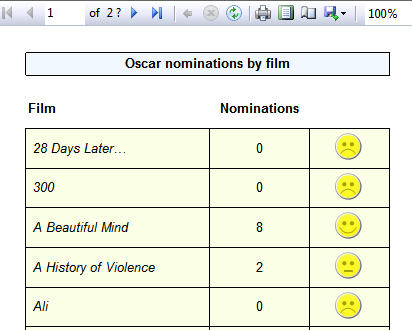
Indicators allow you to display icons next to each row of a report, to give a visual impression of how it fairs in comparison to other rows. In the following example, the report shows a smiley face for a film winning more than 5 Oscar nominations, but a frowning face for one not winning any nominations.
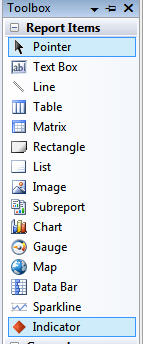
You can add indicators by using the new Indicator tool (obviously):
The main indicators allowed are as follows:
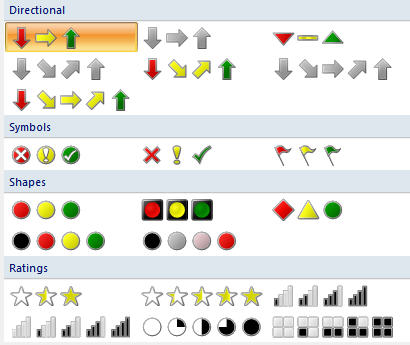
if you're thinking this all looks like conditional formatting in Excel, you'd be right, but actually SSRS does it much better: for example, for any of the icons above you can change the background colour (so if you don't want red, amber and green arrows, for example, you could have pink, purple and mauve ones instead).
Indicators are a joy to use (although they work better when you add a rectangle first), and a welcome addition to Reporting Services. There's a full explanation of how to use indicators here (including their foibles).
Good Thing 2 - Gauges
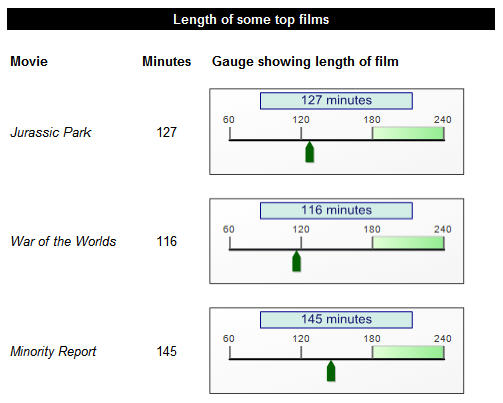
Indicators are actually a specific instance of the more flexible gauges (both were incorporated within SSRS from what was previously an add-in from Dundas, a third-party supplier). You can have either linear or radial gauges - examples of both are shown below. First, an example of a linear gauge to show visually the length of a film (or movie, for those reading this in the States):
Here, by contrast, is an example of a radial gauge comparing film budget with box office takings:
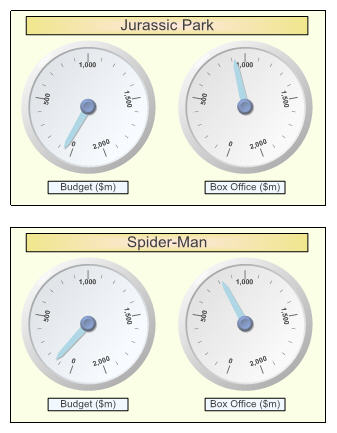
Gauges are easy to add - just drag them from the toolbox into your report - and fairly easy to format, once you've got the hang of the measurement units used. Everything is positioned relative to the top left corner of the object containing it; for example, the caption labels above with the light blue background are:
- 105% of the height of the gauge down from the top of it, and 10% of the height of the gauge; and
- 20% of the width of the gauge in from the left of it, and 60% of the width of the gauge.
All of this means that to get perfect effects you sometimes need a pocket calculator!
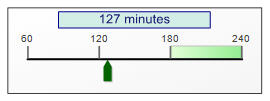
A gauge has 3 main components: the scale, the pointer and the range. In the following diagram:
- the pointer is the dark green triangle;
- the scale goes from 60 to 240 minutes; and
- the range marks the interval 180-240 minutes as being special in some way.
There's a full tutorial on SSRS gauges here.
Good Thing 3 - Charts
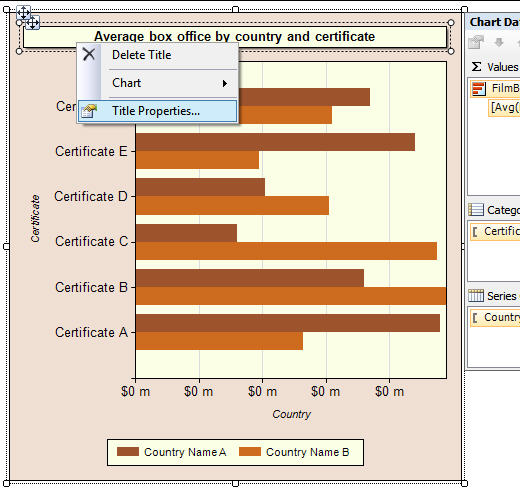
To understand how good charts are in SSRS 2008 R2, you have to know how bad they were in SSRS 2005 (when it was impossible to right-click on any individual part of a chart to format it). Charts now work pretty much the way you'd want them to - for example, in the diagram below you can right-click on a chart title to format it (Excel users might be wondering at this point what all the fuss is about!):
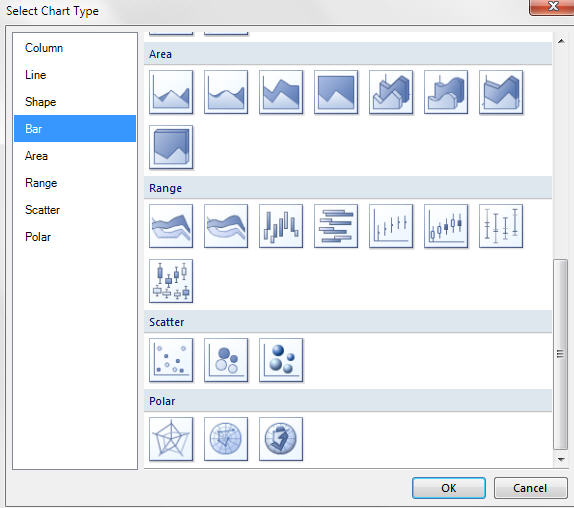
You can see from the dialog box below the range of chart types supported:
All in all, charts are miles better than they used to be. They still suffer from a couple of limitations, however:
- Unlike in Excel, for example, charts are not WYSIWYG (what you see in design views isn't exactly what you get in preview), although this is a necessary consequence of the fact that SSRS reports don't update in real time.
- You can't click on any part of a chart and move it round the screen (a chart title, for example, can adopt only one of 12 positions).
However, credit to Microsoft for turning charts from being hard-to-use to very good.
Good Thing 4 - Maps
At this point I'll freely confess I know very little about this area of SSRS - it's the one feature on which we don't train. However, you can get the idea from this dialog box for adding a new map to a report:
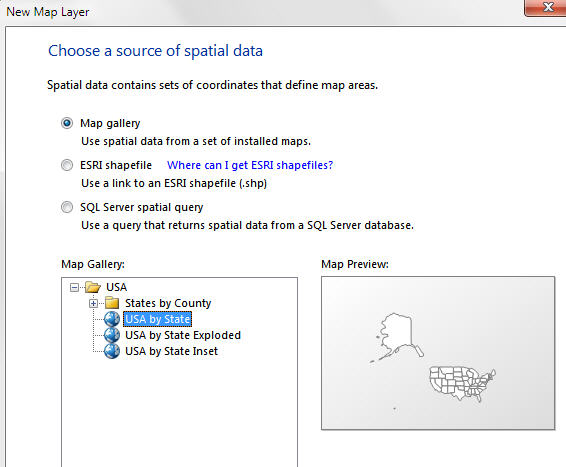
The standard maps provided are - understandably - orientated towards the States, but I'm sure that there's a map of Greater Manchester downloadable somewhere!
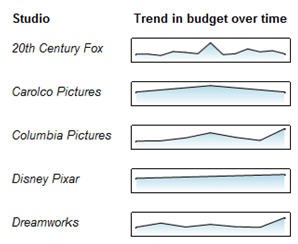
Good Thing 5 - Sparklines/Data Bars
Microsoft seems to be obsessed with sparklines at the moment (they're almost the only major new features in Excel 2010). For those not familiar with the idea, here's an example of each of the aforementioned. First a sparkline to show the trend of budget over time:
Next, the following example uses data bars to compare Oscars won for films across a report and within a group:
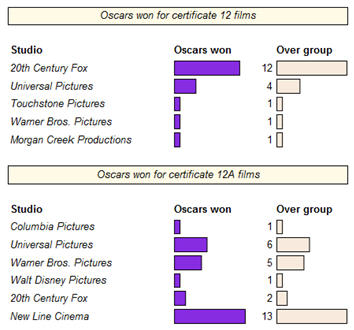
As you can see from these two examples, sparklines and databars are both just miniature charts without axes. I personally find them fiddly to create, and am not a huge fan, but I can see that they could float someone's boat (as the expression goes).
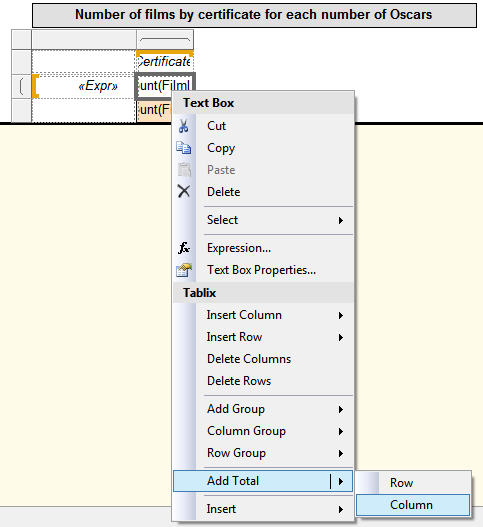
Good Thing 6 - Matrices
With SSRS 2008 R2, matrices are much easier to use. In part this is a consequence of Microsoft's decision to combine tables and matrices into a single tablix report item.
In particular, subtotals are much easier to create and format, as the examples below show. Firstly, adding a subtotal is much more intuitive than it used to be:
Secondly, formatting subtotals is now as it should have been before - easy. So there's no more of the 2005 green triangle syndrome (if you've been using SSRS a while, you'll know exactly what I mean).
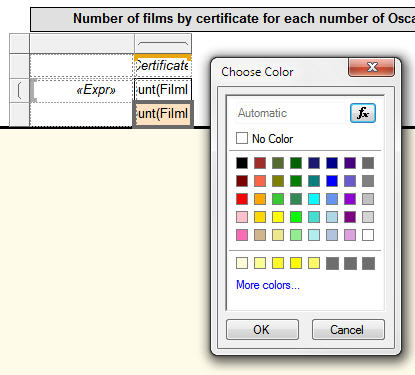
What this means is that if you want to make your subtotals yellow, for example, you just click on them to select them and choose the yellow colour - simple!
Good Thing 7 - Rendering Formats
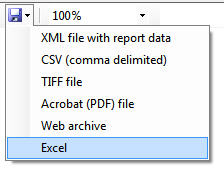
The SSRS 2005 render formats are shown below:
The equivalent 2008 R2 formats are as follows:
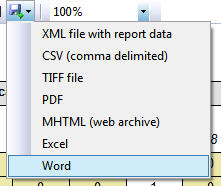
As this shows, Microsoft have added Word to the list. However, they've also introduced the ability to create Excel workbooks containing one worksheet per group of a report, as the next "good thing" shows.
Good Thing 8 - Better Pagination
Report paging works better in many ways.
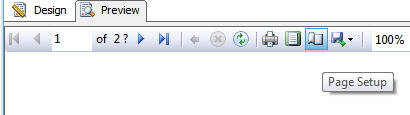
Firstly, SSRS now doesn't calculate how many pages there are on a report when you preview it. So in the example below, you can't know how many pages there are until you go to the last one:
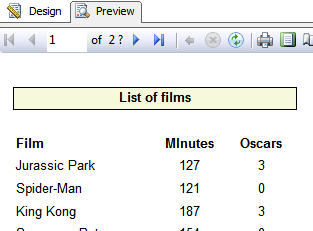
While this may seem a step backwards, it means reports display much more quickly, since SSRS only has to download data for - and format - the first page.
Another innovation is the ability to assign a name to a page:
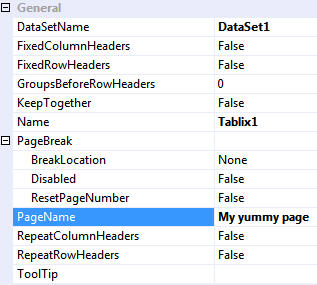
What we really like is the fact that you can test the render format for any report, and if it's Excel use the PageName property to create individual worksheets for each member of a group:
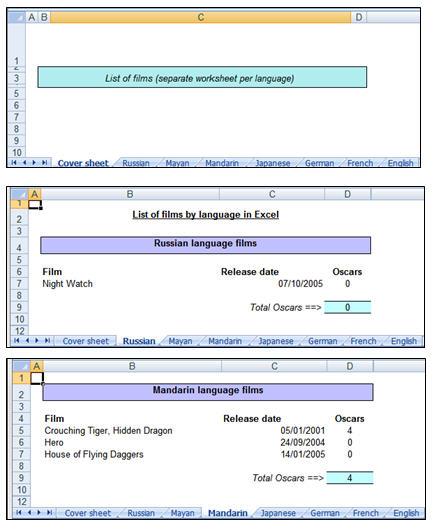
So in the example above, we've created an Excel workbook containing one weeksheet for each language, such that each such worksheet contains all of that language's films. The details of how to do this are beyond the scope of this article, but are explained in this blog on using RenderFormat and PageName to create Excel workbooks.
Good Thing 9 - Better Look and Feel
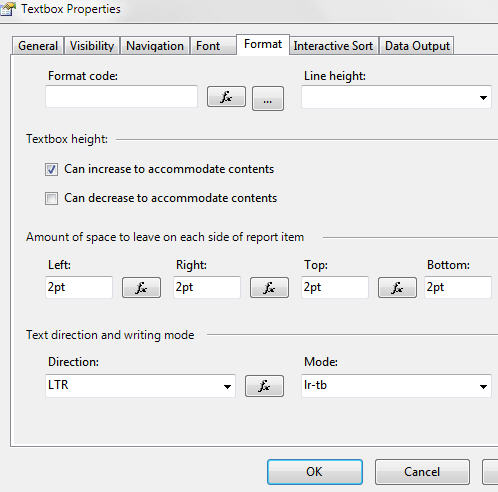
Microsoft have redesigned most dialog boxes in SSRS 2008 R2. Compare this one from 2005:
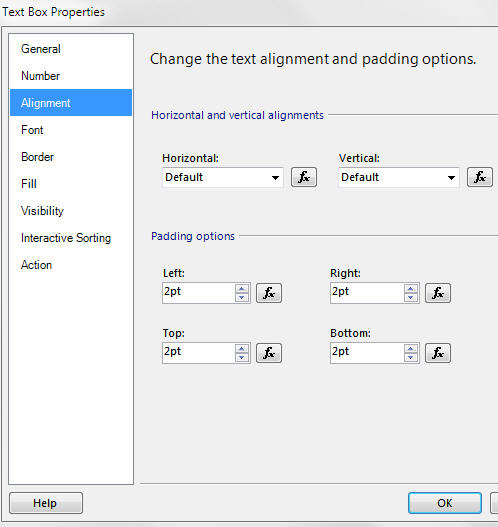
with its 2008 R2 equivalent:
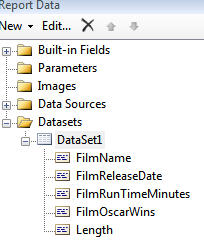
In addition, windows have been tidied up, so that (for example) report data fields and parameters are all chosen from one place:
All in all, SSRS 2008 R2 is nicer to look at than its predecessor.
Good Things 10 - Annoying Bits Removed
This will only mean anything to those of you who are familiar with Reporting Services 2005, but here are some of the "features" removed for 2008 R2.
- Choices made via the page setup icon shown below actually work!
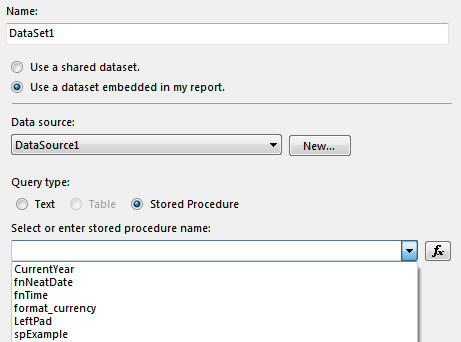
- You can now choose a stored procedure from a list for a dataset, rather than having to type it in:
- Borders work far more sensibly (in particular, when you insert rows or columns SSRS uses much more sensible defaults).
I'm sure there are more irritations removed than this, but it gives the idea!
Conclusion
Microsoft have poured new features into Reporting Services, and made an already powerful software application even better. I'd recommend SSRS unhesitatingly to someone wanting to publish web reports, but would also recommend that you read the sister article to this one - "10 Bad Things About Reporting Services 2008 R2" - to get a balanced picture.
