I’ve been trying to learn more about the T-SQL changes in SQL Server 2005/2008 over time. I don’t have requirements to write a lot of T-SQL, so I have to futz around with it and just try things I see in articles or presentations. One that I’ve been meaning to play with for some time is the PIVOT command.
This command is designed to (from BOL): “change a table-valued expression into another table. PIVOT rotates a table-valued expression by turning the unique values from one column in the expression into multiple columns in the output, and performs aggregations where they are required on any remaining column values that are wanted in the final output.”
That’s confusing, but what this basically does is build a cross tab report. I hate doing this stuff in the db, since I think it’s a waste of resources, but I’m learning, so let’s try something. The examples in BOL work, but I wanted to check them, so I started with Jeff Moden’s Cross Tabs and Pivots, Part 1. That was easier to read, and it’s a great introduction. So I build a table.
CREATE TABLE Repairs
( AUTO VARCHAR(20)
  , RepairDate DATE
  , Repair VARCHAR(20)
  , cost NUMERIC(6, 2)
)
GO
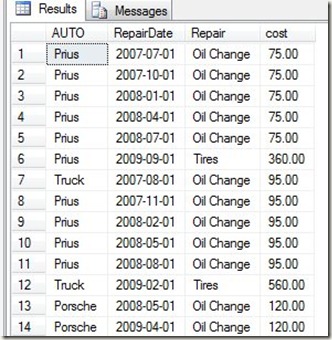
INSERT Repairs SELECT 'Prius', '7/1/2007', 'Oil Change', 75
INSERT Repairs SELECT 'Prius', '10/1/2007', 'Oil Change', 75
INSERT Repairs SELECT 'Prius', '1/1/2008', 'Oil Change', 75
INSERT Repairs SELECT 'Prius', '4/1/2008', 'Oil Change', 75
INSERT Repairs SELECT 'Prius', '7/1/2008', 'Oil Change', 75
INSERT Repairs SELECT 'Prius', '9/1/2009', 'Tires', 360
INSERT Repairs SELECT 'Truck', '8/1/2007', 'Oil Change', 95
INSERT Repairs SELECT 'Prius', '11/1/2007', 'Oil Change', 95
INSERT Repairs SELECT 'Prius', '2/1/2008', 'Oil Change', 95
INSERT Repairs SELECT 'Prius', '5/1/2008', 'Oil Change', 95
INSERT Repairs SELECT 'Prius', '8/1/2008', 'Oil Change', 95
INSERT Repairs SELECT 'Truck', '2/1/2009', 'Tires', 560
INSERT Repairs SELECT 'Porsche', '5/1/2008', 'Oil Change', 120
INSERT Repairs SELECT 'Porsche', '4/1/2009', 'Oil Change', 120
I have repairs and some dates for my cars. What I was trying to do is take the table and pivot it so I can see the cost per repair per year per car. In other words, take this:
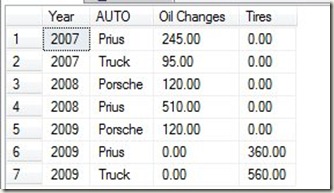
and turn it into this:
I looked over the examples I had, and then wrote this:
SELECT
    Datepart( yyyy, RepairDate) 'Year',
    AUTO,
Sum(Coalesce([Oil Change],0)) 'Oil Changes',
Sum(Coalesce([Tires],0)) 'Tires'
FROM ( SELECT AUTO, RepairDate, Repair, Cost
FROM repairs
       ) AS Expenses
PIVOT( SUM( cost) FOR Repair IN ([Oil Change], [Tires])) AS pvt
Group BY
    Datepart( yyyy, RepairDate)
    , AUTO
ORDER BY  Datepart( yyyy, RepairDate) , Auto
Which works. I choose the columns I wanted (in this case ‘Oil Changes’ and ‘Tires’) to pivot on and then wrote the statement. It works, but it seems hard to read, to me. I tend to agree with Jeff’s assertion in his article that a simple CASE statement is easier to read.
SELECT
    Datepart( yyyy, RepairDate) 'Year',
    AUTO,
SUM(CASE WHEN REPAIR = 'Oil Change' then Cost else 0 end) 'Oil Changes',
SUM(CASE WHEN REPAIR = 'Tires' then Cost else 0 end) 'Tires'
FROM repairs
Group BY
    Datepart( yyyy, RepairDate)
    , AUTO
ORDER BY  Datepart( yyyy, RepairDate) , Auto
But that’s me. I haven’t messed with dynamic columns or other changes, but for now I’m not sold that a PIVOT really is that helpful.


