

Introduction
This is the last article related to Excel and Data Mining. If you want to read the previous chapters, you can go to the previous articles.
- 18 - Excel and Data Mining
- 19 - Excel and Data Mining, Samples, Queries
- 20 - Excel and Data Mining,accuracy, forecasting
- 21 - Excel and Data Mining,validation methods
Requirements
You can read lesson 18 for the requirements for this article.
Analyze Key Influencers
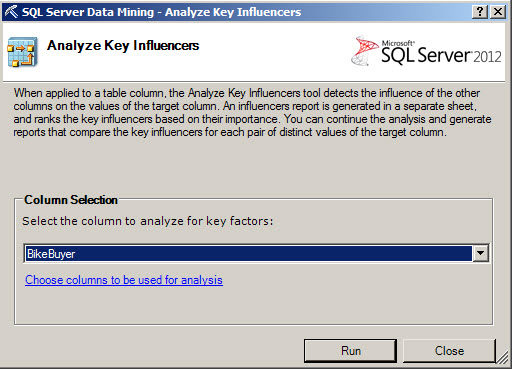
The first option is the Analyze Key Influencers. This option analyzes the columns to verify which ones influence on the results. In this sample we will analyze which columns influence in the customer to be a bike buyer or not.
1. In order to start, go to the SampleData Excel File, select data in the Testing Data Sheet, select the Analyze option Menu and then press the Analyze Key Influencers icon.

2. Select the BikeBuyer column as the column to analyze for key factors. The BikeBuyer shows if the customer will buy a bike or not and the Analyze Key Influencer will show which columns has influence.
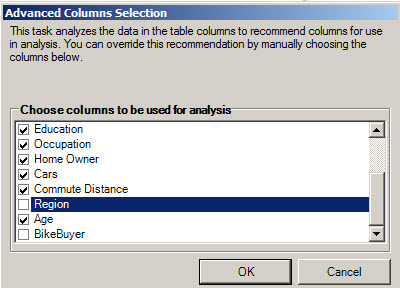
3. In the Windows of step 2, select the columns to be used for analysis and exclude the columns that you do not think are necessary to analyze.
4. It is very common to receive this error message when using any Analyze option in MS Excel for Data Mining:
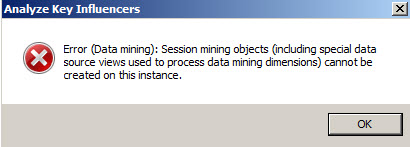
It is a problem related to the Data Mining Session objects that cannot be created on the instance.
5. In order to fix the problem, open the SQL Server Management Studio (SSMS) and connect to the SQL Server Analysis Services.
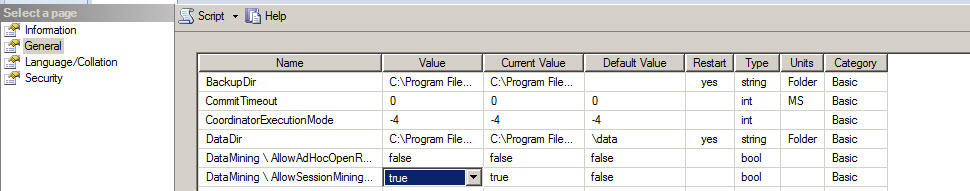
6. Right click on the Server and press properties.
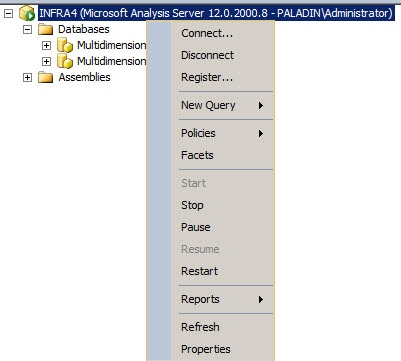
7. On the general page, make sure that the option DataMining\AllowSessionMining is set to true (by default value is false).
8. Once solved repeat the steps 1-3 and in the Discrimination based on key influencers, press Add Report.
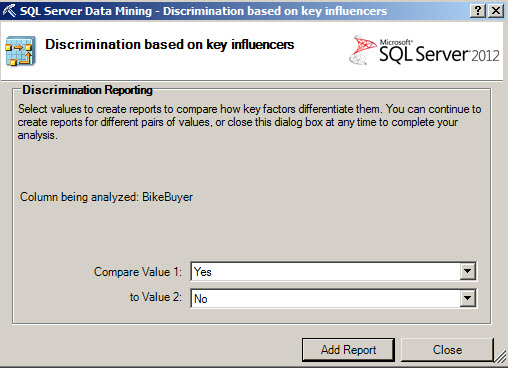
9. You will have the following report.
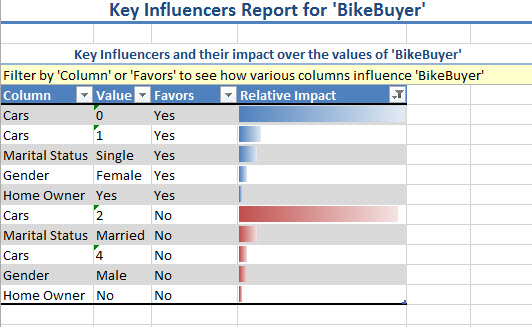
The blue bars show the information of the customer who may bike a bike. The customers with 0 or 1 car, may buy a bike. By the other hand, users with 2 cars may not buy a car.
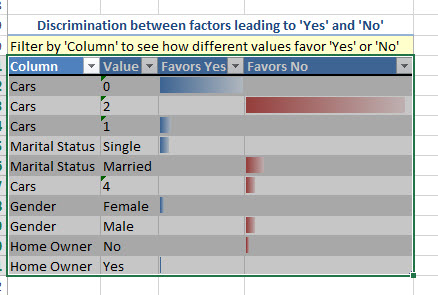
10. The discrimination section compares the results of the customer who will buy with the customer who will not buy a bike.
Detect Categories
The detect categories option let you group columns with similar characteristics.
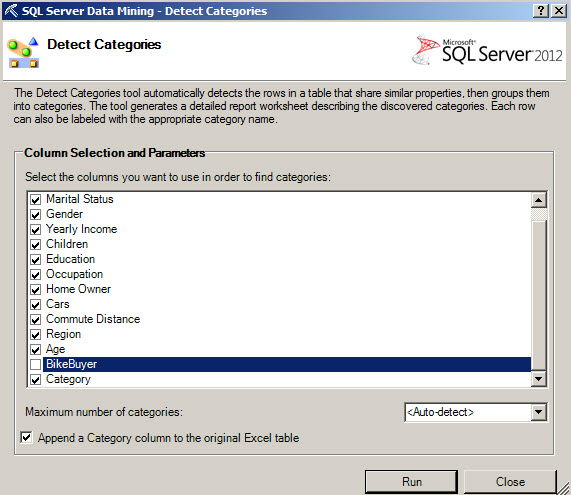
1. To Detect Categories, press the Detect Categories icon.

2. In the detect categories Window, select the columns that you want to categorize and press Run.
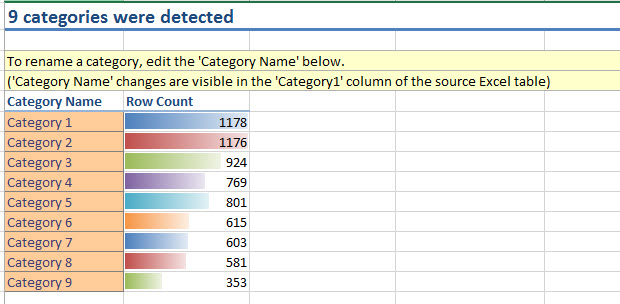
3. In these sample 9 categories were created and you can see the number of rows per category.
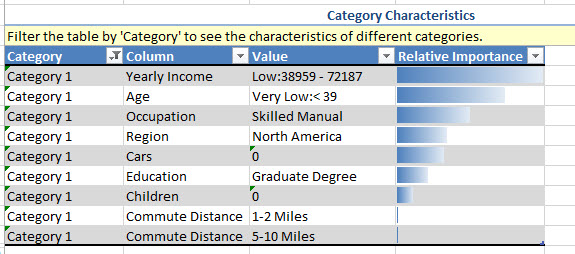
4. You can also see the group characteristics and the typical value for the columns in each category.
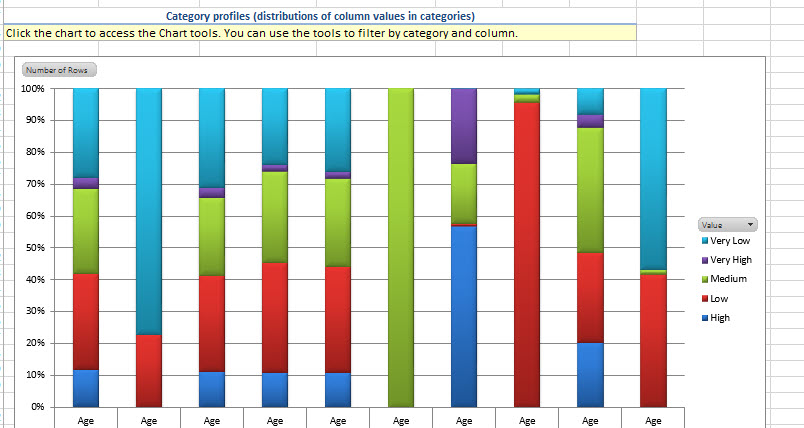
5. You also have a chart to see the distribution of the data.
Fill from Example
If you have incomplete columns, you can fill and guess the information using the Fill from Example option.
1. For this example in the Excel file go the Fill From Example spreadsheet. This example will complete the information to evaluate if the customer is a high value customer or not based on the other columns.

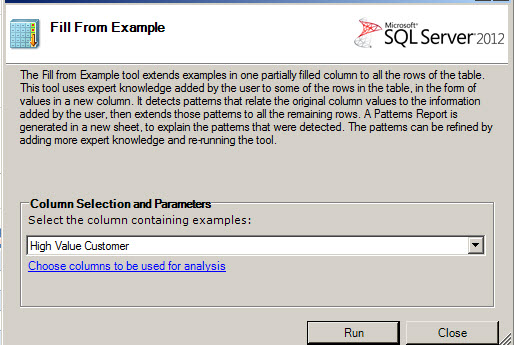
2. Press the Fill From Example icon.

3. Select the High Value Customer column to fill it and press Run.
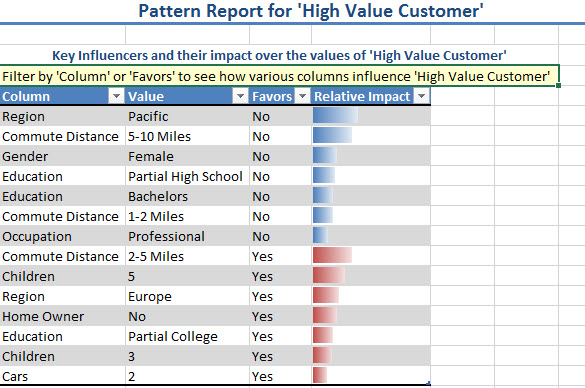
4. The Excel will show the columns than influence in the values to complete the information. Values like the Region from pacific, the Commute Distance of 5-10 miles influence in the values to determine if the customer is valuable or not.
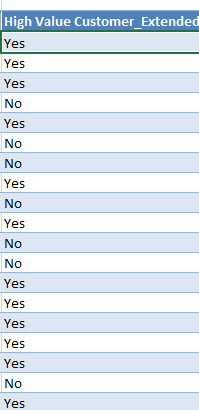
If you return to the Fill from Example Spreadsheet, you will notice that a new column is created labeled High Value Customer_Extended. And now the information
Forecasting
Forecasting as the name says is very useful to predict future sales, revenue over the time based in old information. The theory about forecasting was explained on detail on the Lesson 6, time series algorithm.
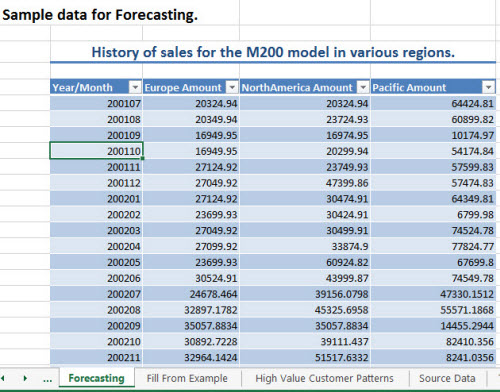
1. In order to start, in the Excel file, go to the Forecasting Spreadsheet.
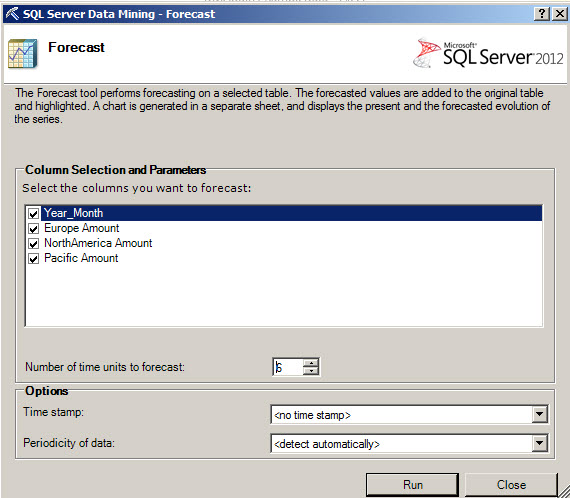
2. Press the Forecast icon.

3. Select the columns used as parameters and specify the number of time units to forecast to 6 and press Run.
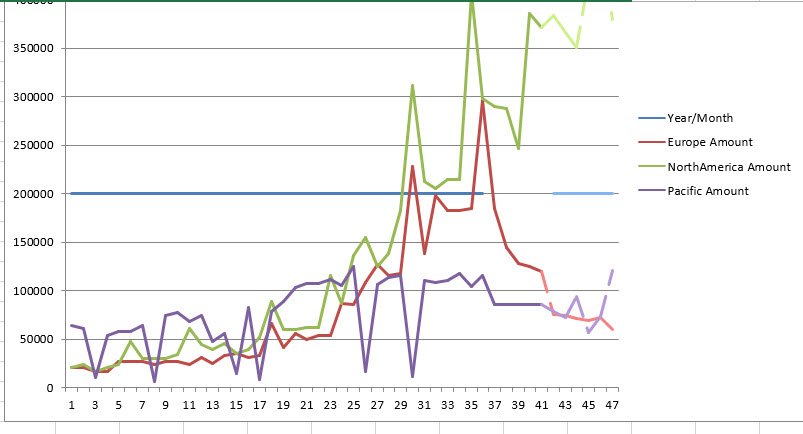
4. The reports shows the amount of money from Europe, North America and Pacific per month. The values dotted are the predicted values. According to the chart, the amount earned in Europe will go down and the amount earned in North America will increase over the time.
Highlight Exceptions
Highlight Exceptions let you detect weird values that are out of the normal ranges and highlight them.
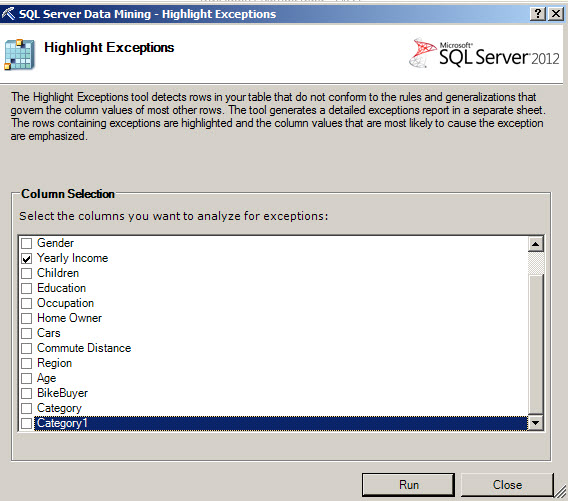
1. Press the Highlight Exceptions icon.

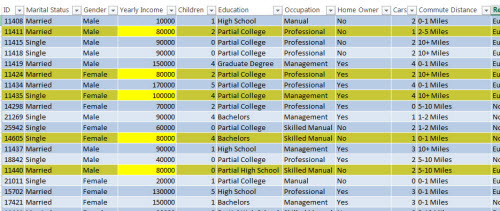
2. Select the column to analyze. In this sample, we will analyze if there are values in the Yearly incomes of the customers and press run.
3. A new report will be displayed with the Highlight Exceptions.
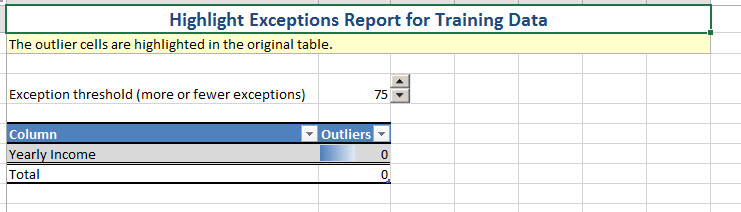
4. If you check the data analyzed, you will notice that some Yearly Incomes are now highlighted.
Scenario Analysis
Scenario Analysis let you analyze hypothetical options:
- The Goal Seek
- The What if
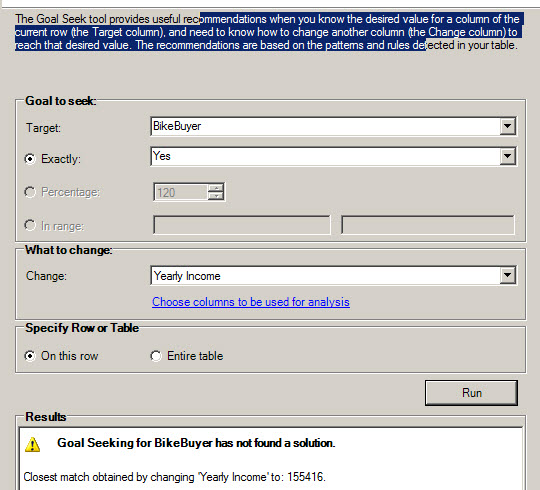
The first option is the Goal Seek. With this option, we analyze the values to meet a goal. For example if we have a customer who is not a potential customer, the option finds what of the characteristics should change to be a customer.
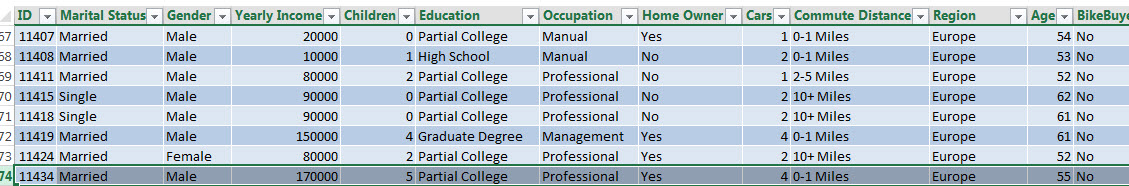
1. In order to test the Goal Seek option, select a row.
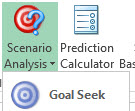
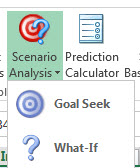
2. Press the Scenario Analysis>Goal Seek
3. In this Example we are going to analyze the Yearly Income necessary to be a BikeBuyer(BikeBuyer=yes). For this purpose, select the BikeBuyer as a Target and the Value should be Exactly Yes. The value to change will be the Yearly Income and we are going to analyze only the selected row on step 1.
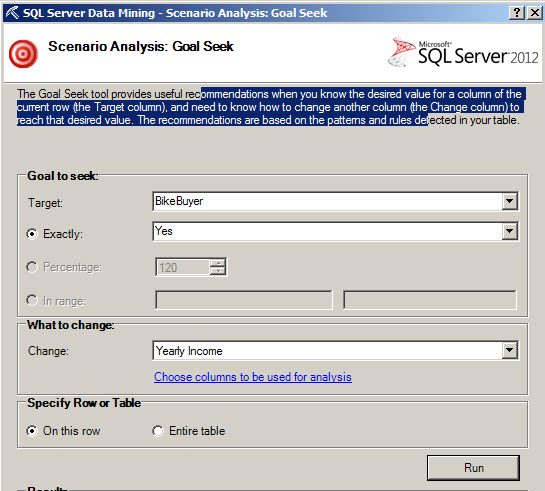
4. If everything is OK, you will have the result that the Yearly Income should be 155414 to buy a bike. This way you can analyze different columns related to the customer information and analyze what do the customers require to be potential buyers.
6. The other option is the What - If. This option allows you to modify values and see the results. It is similar than the Goal Seek, but in this case, you assign a value and obtain the result. In order to test this option, go to Scenario Analysis and select the What -If option.
7. We are going to analyze what happens if the Yearly Income is just 20000 on the same row selected in step 1.
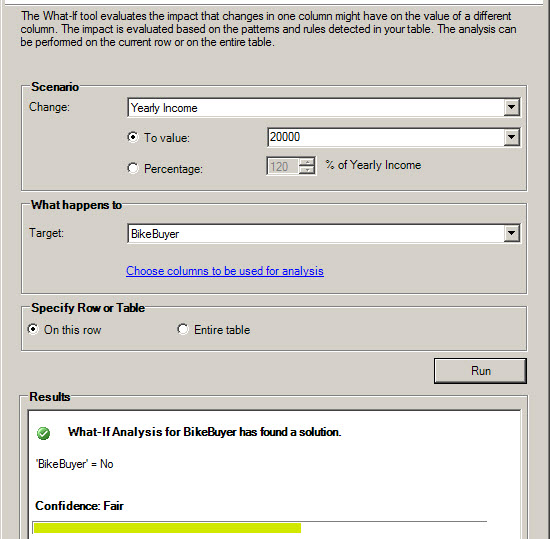
8. As you can see, the result is that the customer would not be a Bike Buyer (BikeBuyer=no).
As you can see, you can easily play with the values and have great results.
Prediction Calculator
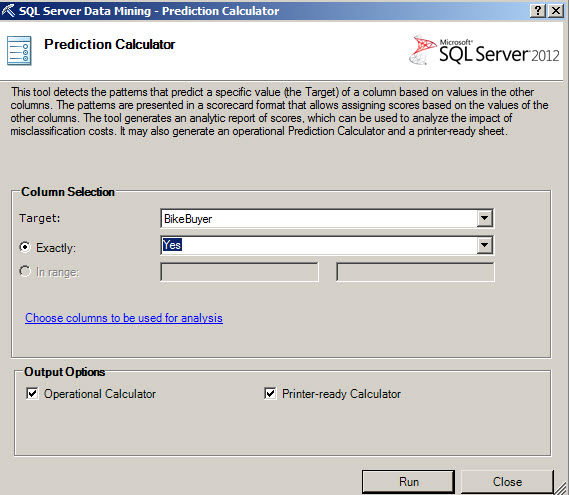
This option is great to detect patterns and influences from other columns to a selected one.
1. In order to start, press the Prediction Calculator.

2. Select the BikeBuyer as a Target.
3. The report generated shows different sections.
The first part contains 4 scenarios.
- The False Positive Cost in this case is when the model indicates that it is a Bike Buyer customer, but it is not. That has a cost because we will spent money in vain to contact the customer.
- The False Negative Cost is when the model indicates in this case that the customer is not a Bike Buyer, but the model is wrong. We will lose some money because of the model inaccuracy.
- The True Positive Profit shows Bike Buyers correctly predicted generating a profit.
- The True Negative Profit is when the model correctly predicts if the customer is not a Bike Buyer.
We have to analyze the costs and profits to verify if the model works.
You also have the score breakdowns, which shows the impact in the BikeBuyer option. For example the marital status has no influence in the customer to be a bike buyer or not, while he Yearly Income is closely related.
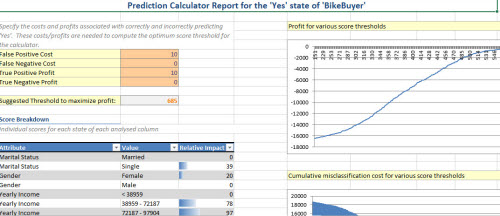
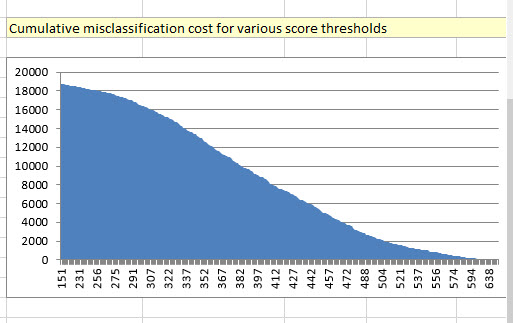
The cumulative misclassification cost shows the cost of making wrong decisions based on the inaccuracy of the model. This
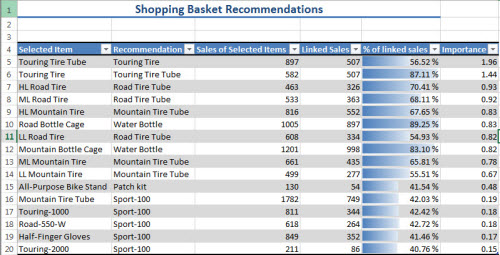
 Shopping Basket Analysis
This option is related to the Basket Analysis. It is related to the Microsoft Association Rules explained in the lesson 7. You can find the relationship between products and predict other products based on the first one.
1. Make sure you are in the associate Spreadsheet.
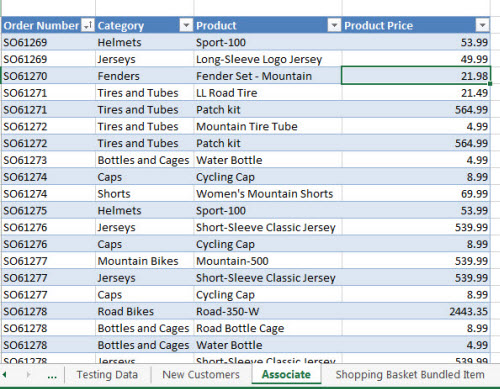
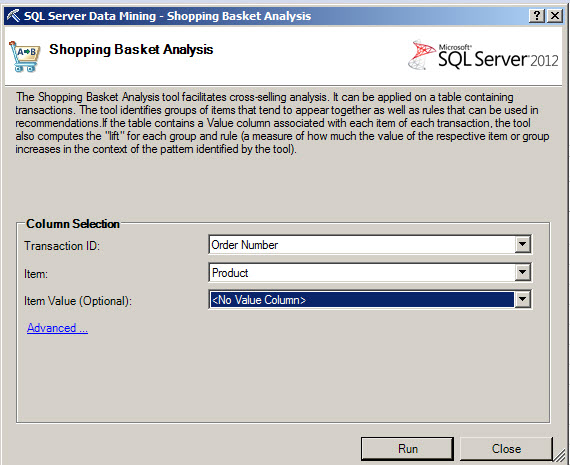
2. In order to start, press the Shopping Basket Analysis option.

3. Select the Order Number as the Transaction ID and in the Item select product and then press run.
4. As you can see, the Touring Tire Tube is related to the Touring Tire. The HL Road Tire with the Road Tire Tube. The report show the relationship between products with a simple click.
Conclusion
In this lesson, we used the options to analyze the Data. We Analyze the influencer columns, we detect categories of people, we use an option to fill information based in other samples, we forecast, we highlighted exceptions, We analyzed hypothetical scenarios, we predict values and finally we made a Shopping Basket Analysis.