

Introduction
In the lesson 18, we learned how to install the plugin to administer and query Data Mining Models using Excel. We also learned how to create a Cluster Model using Excel. In this new lesson we will learn how to clean the information, how to explore information, how to get a sample of data, how to classify the data using decision trees and finally how to query the model.
Requirements
Here are the assumptions for this article.
- We are using SQL Server 2014 for this lesson, but SQL Server 2005/2008/2012 can be also be used. We are assuming that you already have the Data Mining Project used in the Data Mining Part 13. If you do not, you can install it or use any other Data Mining Project already installed.
- We are using Microsoft Office 2013, but earlier versions can also be used.
- The Data Mining plugin for Excel 2007 and SQL Server 2008 can be downloaded here.
- We are using the Data Mining plugin for Excel 2010, 2013 and SQL 2012 and 2014, which can be downloaded here.
- There is also an Excel File with sample data very useful to learn data mining with Excel. You can download the file here.
Explore Data
Explore Data let you create nice charts using the information. Follow these steps to create a chart.
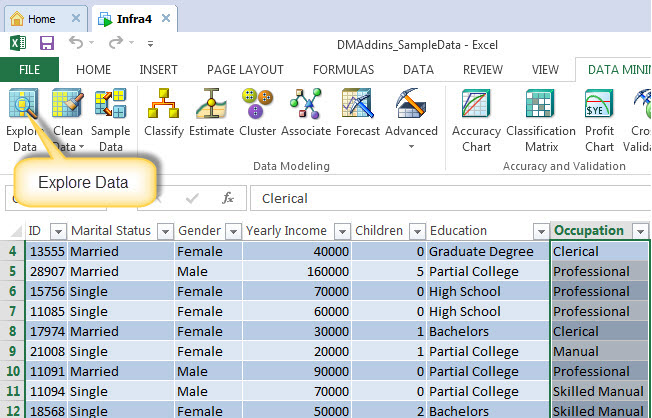
1. In Excel, click on the Data Mining Menu Option and then press the Explore Data Icon.
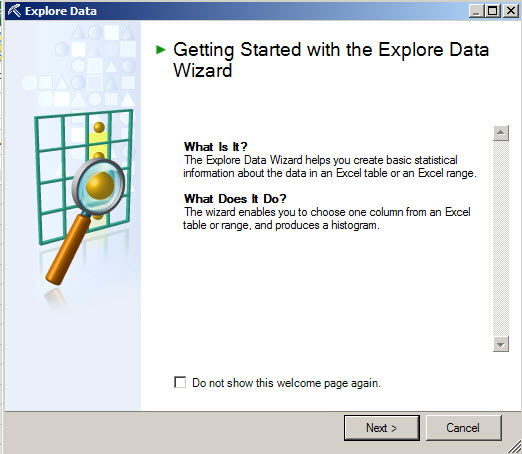
2. The Explore Data Wizard will be displayed. Press the next Button.
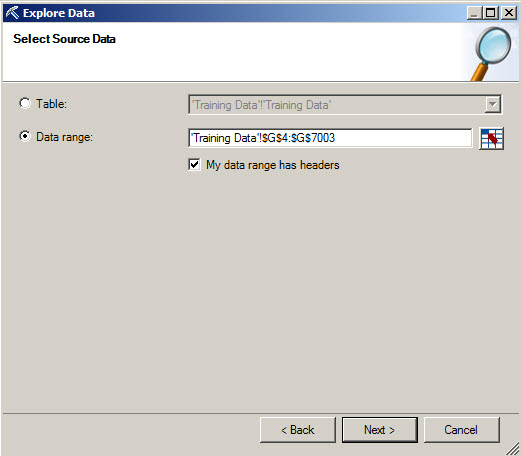
3. If you did not select the data, select the data to be explored. In this sample, we selected the occupation column to be explored. Press Next.
4. As you can see, a bar char is displayed showing the occupation and the number of customers per occupation.
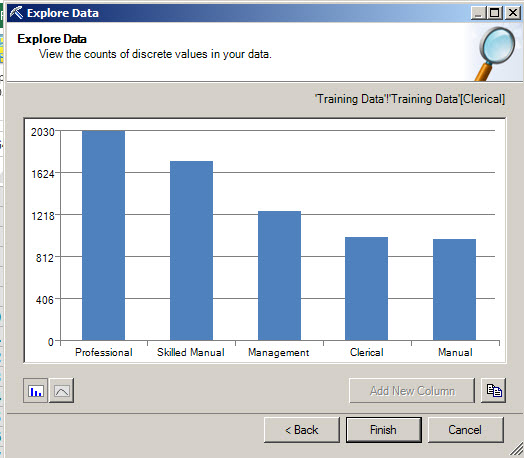
The Explore Data option can create nice charts that allow you to visualize the information.
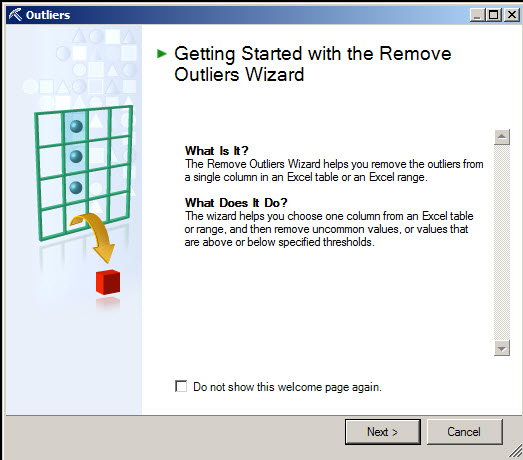
Outliers
The Outliers button provides a good way to clean the information. Sometimes we have some typos, or some customers who do not help to the model.
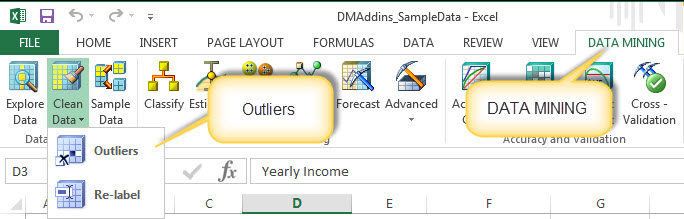
1. The next task is to clean the data. First, we will work with the Outliers option. For this sample, we will select the Yearly Income column.
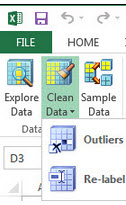
2. Select the Clean Data icon and then Outliers
3. The Wizard will be displayed. Press next.
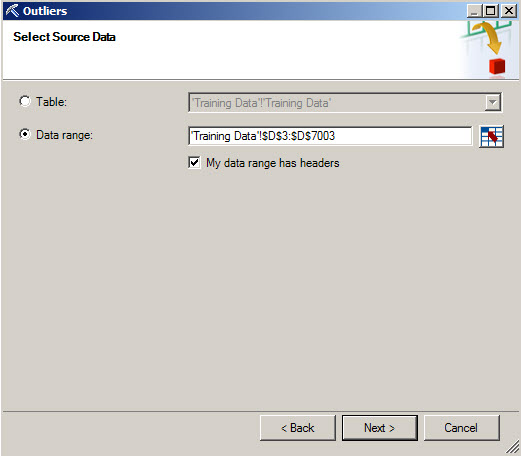
4. You can select the data to be used in this option, or if you did this before in step 5, the data will be already selected. Press next.
5. You will have a graph of the salaries and the number of customers per salary. With the sliders you can remove some data to clean it.
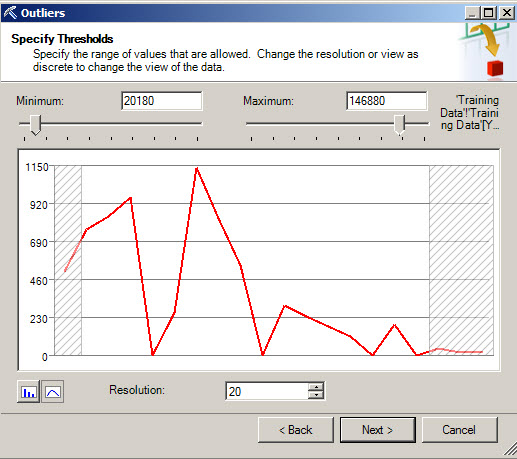
This is very useful when you have garbage in your information. For example, imagine that you have Bill Gates in your database as a customer.

Do you believe that it is a great idea or it will help to your Mining Model to have a billionaire in your list? It is recommended to ensure your data is clean and without unusual values. The same could be true if you have customers without a job. There are useless for our model.

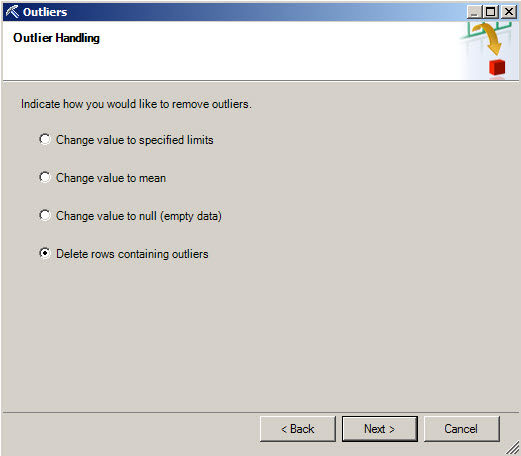
6. Once you have selected the area to remove or change, you can change values to the specified limits, change values to mean, change value to null or delete the rows containing outliers. You can press next after selecting an option.
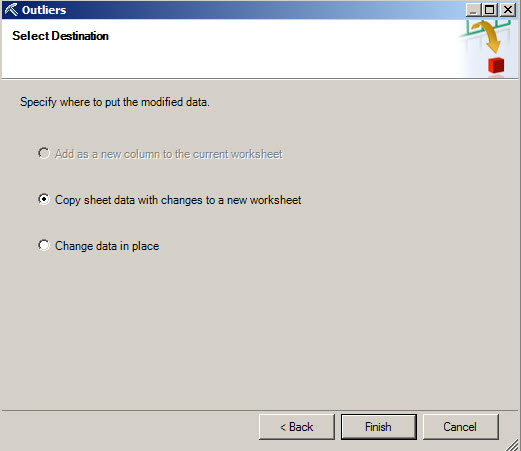
7. You can copy the data modified in a new worksheet or change the data in place. Press Next after selecting an option.
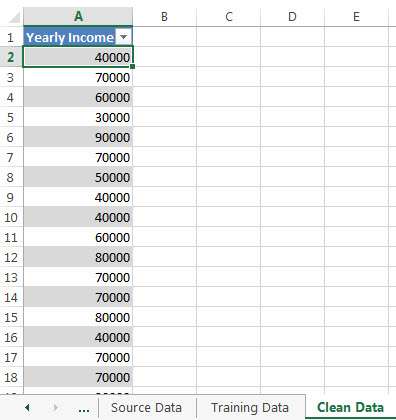
8. Now, the outliers have been removed and a new sheet with the data modified is created.
Re-label
1. The next exercise is to re-label the information. Select the Occupation column.
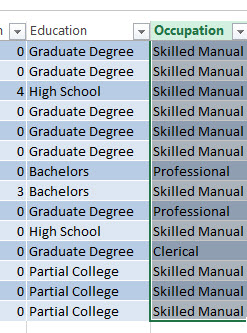
2. To re-label the information, go to Clean Data and select the Re-label option.
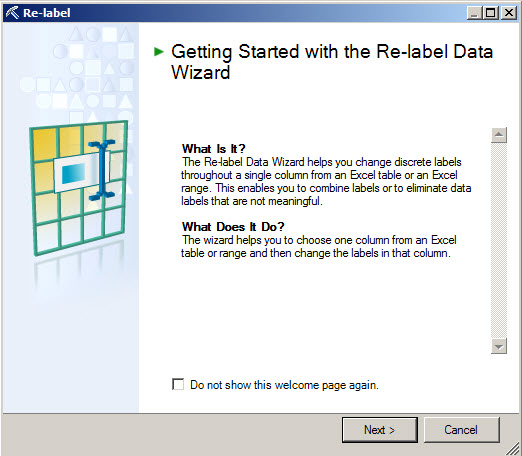
3. In the new Wizard, press next.
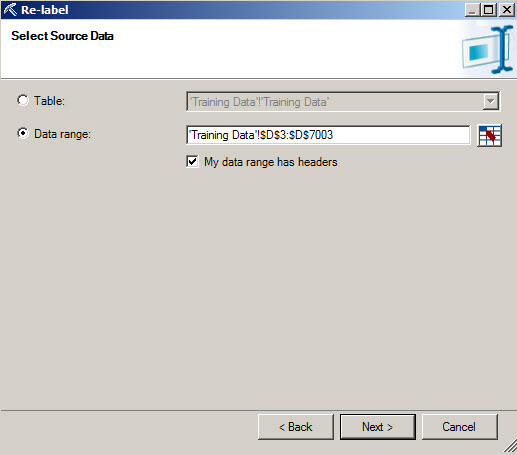
4. If not selected, select the range of data and press next.
5. The re-label process can be used to change the information into different languages or to create a more descriptive description.
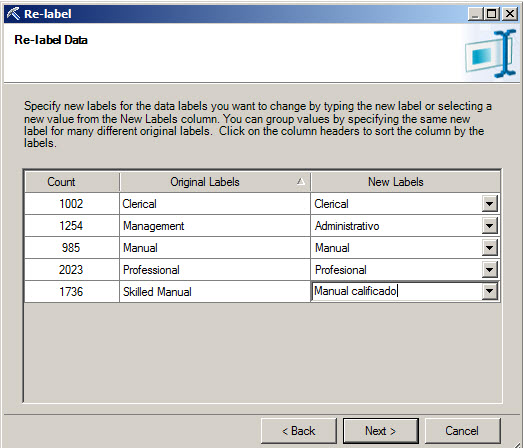
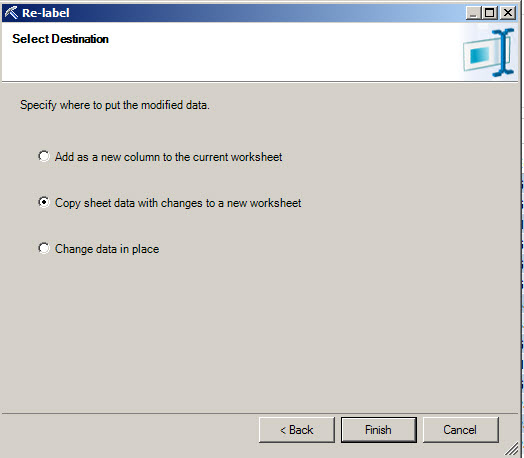
6. You can add the information the worksheet, change the data in place or copy in a new worksheet.
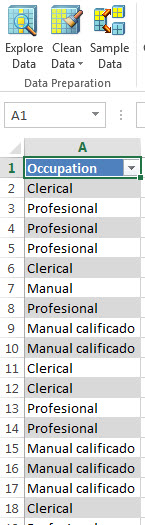
7. If everything is OK, you will have all the information in the worksheet.
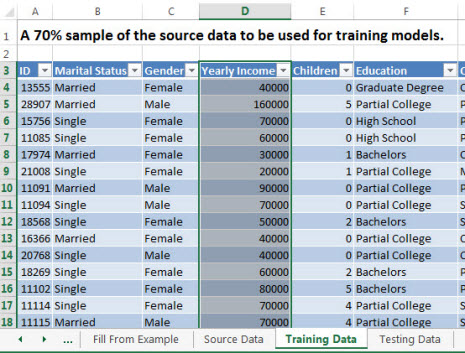
Sample Data
You can get a sample of data with this option. I think this option is pretty cool and useful.
1. Click the sample data icon.
2. A new wizard will be displayed. Press next.
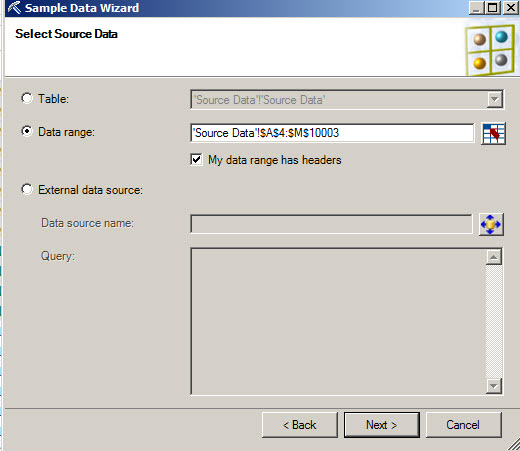
3. Select the range of data if not selected before.
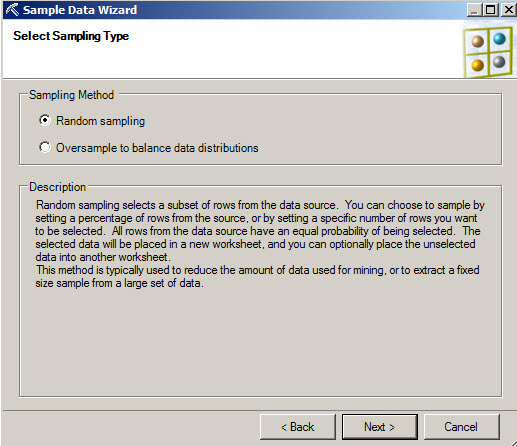
4. You can select a random sampling and press next.
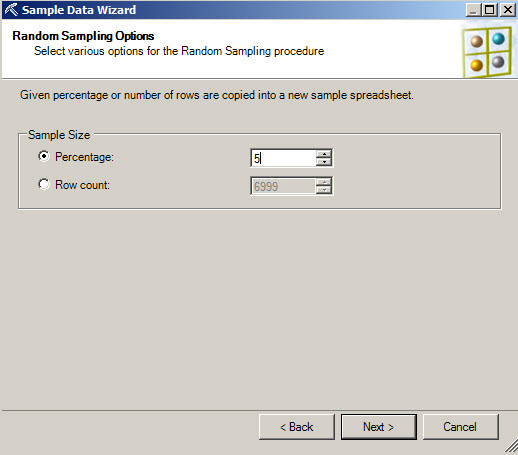
5. You can select the percentage of the sample. You can also select a specific Row count.
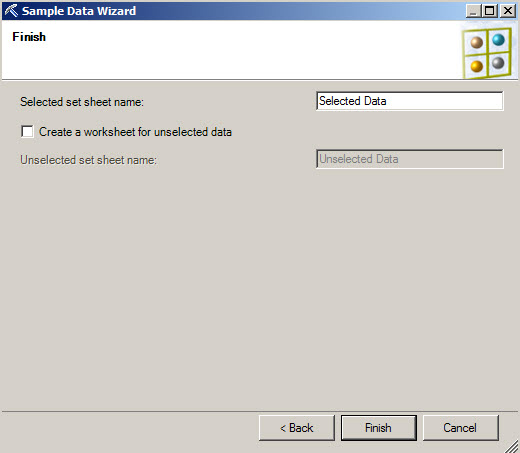
6. You can have a worksheet with the selected data and a worksheet of unselected data.
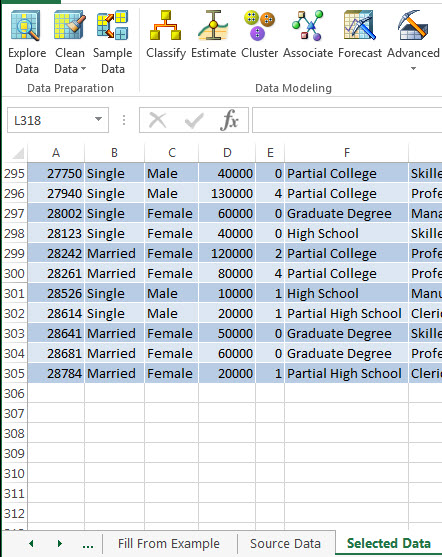
7. In this picture, you will be able to see the sample of data.
 Classify with decision trees
Classify
The classify option lets you create a decision tree algorithm with the current information. If you are not familiar with decision trees, please read the lesson 2 of this series.
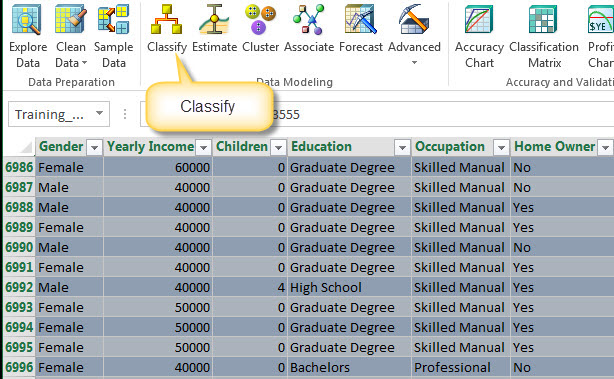
1. To start this, select your data to analyze and press the Classify option.
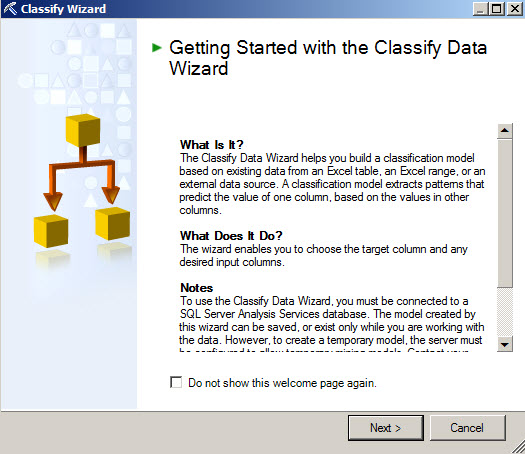
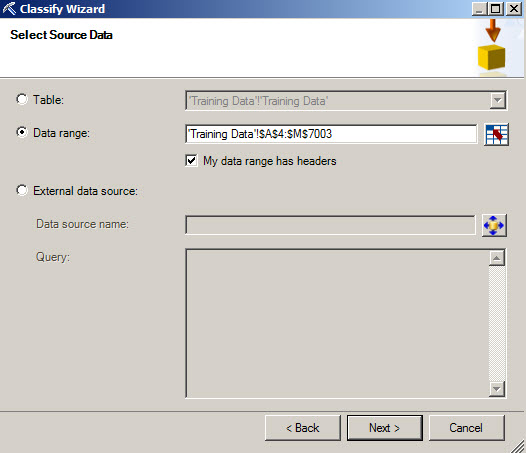
2. The Classify Wizard will be displayed. Press next.
3. If not selected before, select the range of cells.
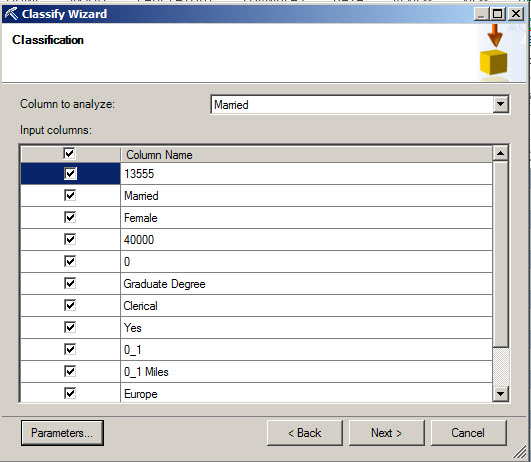
4. Select the column to analyze. Please select the bike buyer option. Also, select the columns used as input. You also have a Parameters option. Press it.
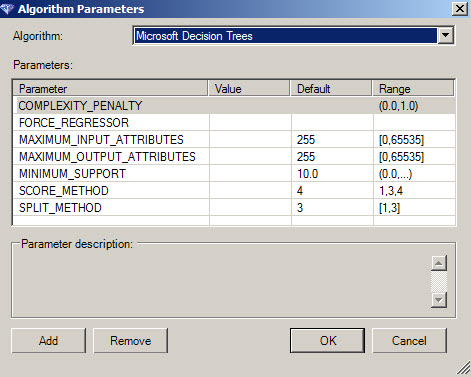
5. If you are not familiar with the Decision Trees parameters, please refer to this link. Do not change anything in this Window I just wanted to present it to you. Press OK and in the input window press next.
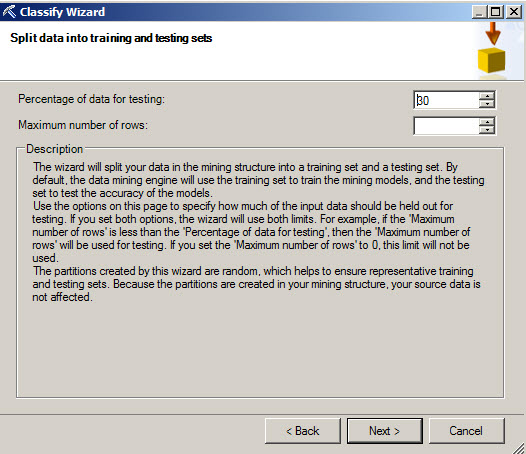
6. The data used requires data to train the model and the rest to test the accuracy of the model. Leave the default values and press next.
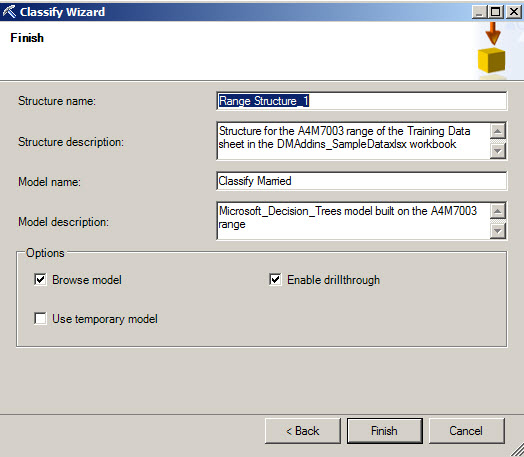
7. Finally, you can write the name of the structure, the model, the description and the options to Browse and Drillthrow. Once selected this options, press finish.
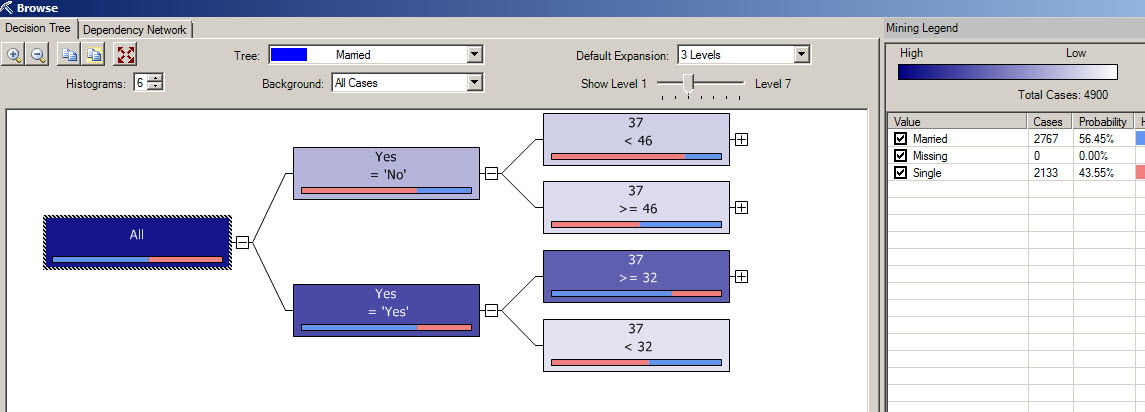
8. If everything is OK, you will have the decision trees windows with all the options of the decision tree
How to create Data Mining queries in Excel
There is an option to create your DMX queries visually or manually. If you need to create queries, this section is for you. You do not need to know DMX for this section, but if you need more advanced options, I recommend you to learn it. For more information about DMX, read the lesson 12.
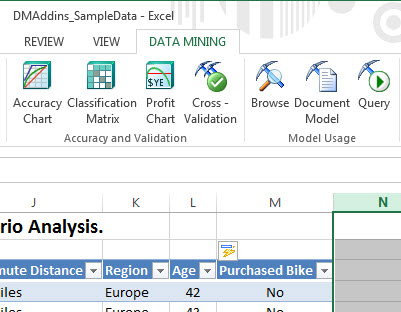
1. In order to create queries select the Data Mining menu and press the Query icon.
2. In the Data Mining Query Wizard, press next.
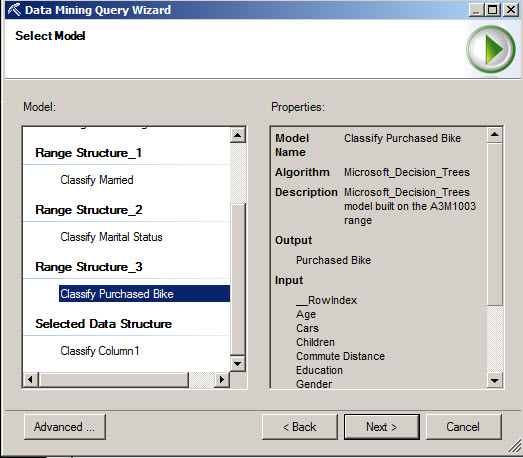
3. Select a Model that in this case would be decision tree model created before.
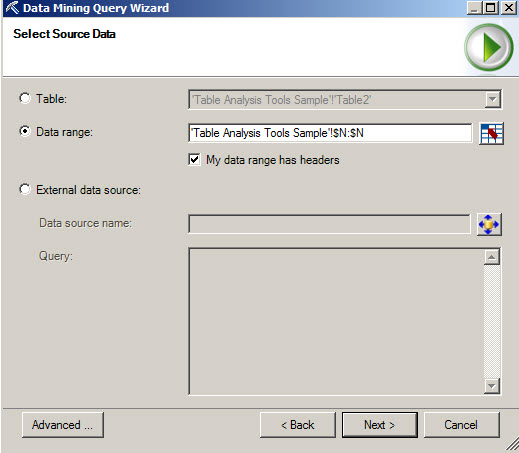
4. If not selected, select the range of data and press next.
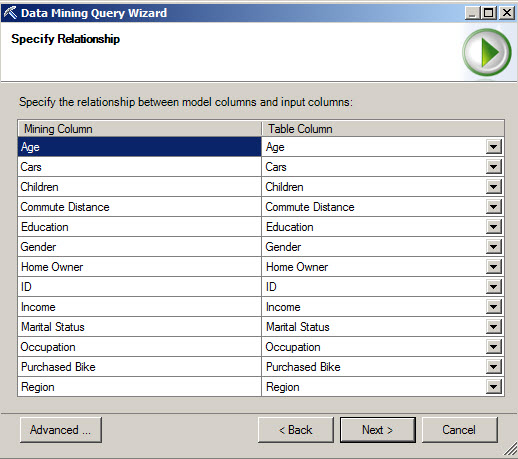
5. If the relationship was not established, create a relationship between the Mining Model and the Table Column. This option will create a relationship between the columns of the Mining Model and the Excel file.
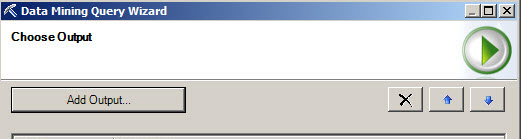
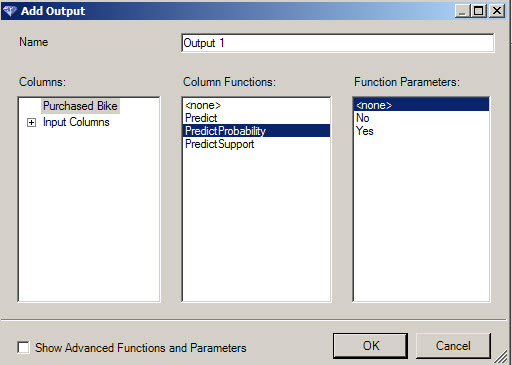
6. In the Choose Output, select the Add Output button.
7. Select the Purchased Bike option and select Predict Probability and press OK.
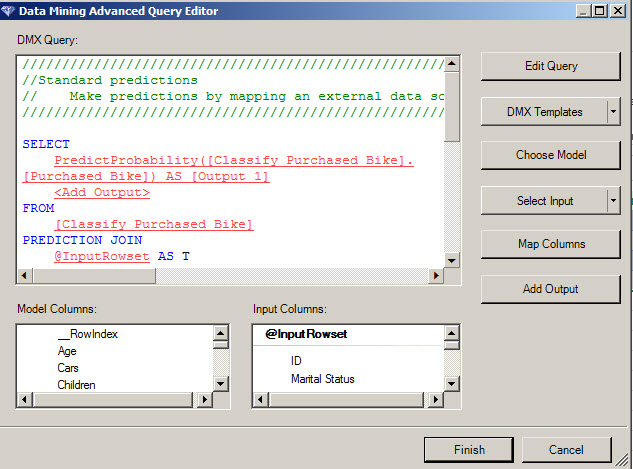
8. You can see the MDX query created with the Advanced button, press it to check.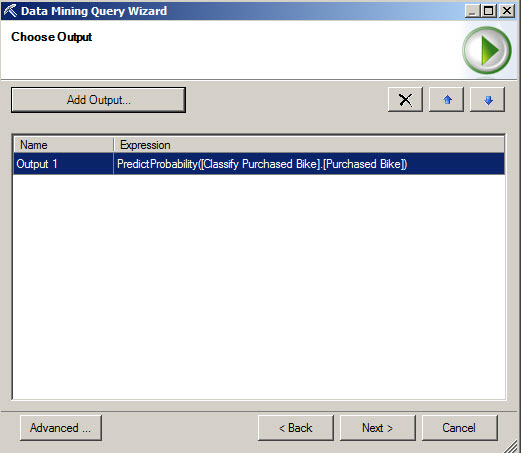
9. You can watch the DMX query here and edit the query. Press OK and in the Choose Output Window, press next.
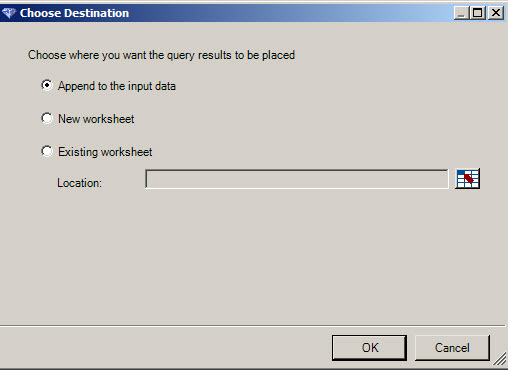
10. You can append the Data, create a new worksheet with the new information or add to an existing worksheet.
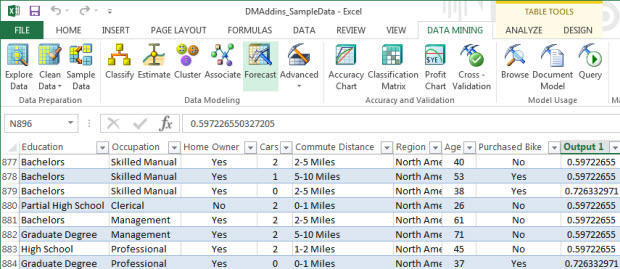
11. As you can see, a new column was created with the probability of the customers to buy a bike.
Conclusion
As you can see, there are nice tools to explore the information, clean the information and by the other hand we show how to create the Decision Trees and how to query the models with Microsoft Excel.
The Excel for Data Mining Add-ins is a straightforward tool that anyone can learn easily.