Most report consumers in any business are also Excel users. They create their own lists and pivot tables in Excel - nearly always with a considerable degree of skill. This means that they are used to interactive and intuitive ways of interacting with their data. Slicers are one technique which they probably use. Consequently adding slicers to Reporting Services is something that can have real appeal to BI report users – and that is what we will look at in this article.
Slicers are nothing more than a visual selection technique. In this article.I will show you how to create dynamic slicers where a set of slicers is created from the source data. This technique allows the user to select a single slicer element that then filters the data in a report. In this article you will see how to refresh a chart – just like you could filter any table, gauge or map in an SSRS report. Incidentally, you may find that users find that interface enhancements like this are a real boon to mobile reports, now that these are possible with SQL Server 2012 SP1 - and of course, SQL Server 2014.
I am going to presume that you already have a reasonable knowledge of basic SSRS and that you can build SSRS reports– but that you may not yet have ventured into enhancing the SSRS interface. If you need further information on ways to use SSRS for BI, then please consult my book, Business Intelligence with SQL Server Reporting Services – Apress – February 2015.
You will need to download the sample data for this report to work properly. Specifically, you should unzip the attached file to the directory C:\BIWithSSRS. The sample data contains:
- The database CarSaleReports_SSC with all the data and stored procedures needed to create the report – you will have to restore the backup file into a local SQL Server 2012 database.
- The image files used for the slicer buttons
- The finished report
Adding Slicers to a Report
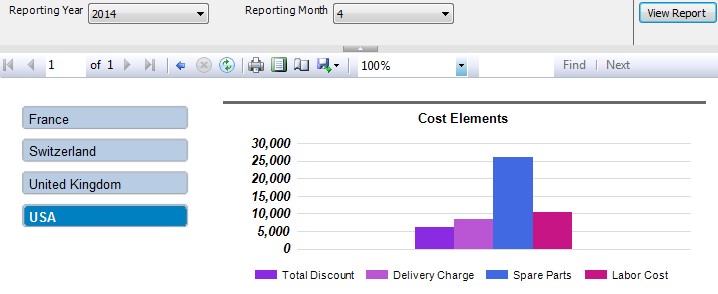
Slicers are nothing more than a parameter selection presented in a visually appealing way. What we will be doing here is to use a tablix to become a slicer set. This allows a dynamic set of choices to be returned from the source data. In this specific example the slicer is the country. An example of the final output is shown below. Once the report if finished, clicking on a country name displays the cost metrics for that country as a chart. This is done through setting a standard – but invisible - SSRS parameter (Country) to the country that was clicked – or tapped if you are using a mobile device.
All the interface tweaks which we will look at in this article are based on one simple technique. I can only describe it as parameter postback for want of a better term. In its purest form it consists of:
- Hiding the report parameter
- Using the Action property of a report element (be it a textbox, chart series or even map viewport) to refresh the current report and "post back" the parameter with a new value - and all other parameters with their current value.
I used the term "refresh" here, where in fact what Reporting Services is doing is to jump to the report as if it was being opened afresh.
This simplified overview requires a number of comments to make you aware that this approach does have its downsides. They include:
- All hidden parameters - and not just the one whose value you are changing - have to be defined as part of the Action property which you are setting. In other words, there is no "viewstate" in Reporting Services, and unless you want a parameter to revert to its default value, you will have to pass its current value to the refreshed report in every action property.
- As all the hidden parameters have to be posted back to the report when it is refreshed as a part of every action property it follows that the more the interface is revamped to allow for multiple interactive selections - the more you will be setting multiple parameters to return their existing value.
- If you do not pass back the current value of a parameter it will be reset to its default value. This can rapidly lead to a lot of time spent tweaking action properties when you add new parameters to a report.
- You no longer have the option to refresh a report once all parameters are set, as the report will refresh every time a single parameter is changed.
- Refreshing a report is not instantaneous. Consequently you may have to pay attention to the size of the dataset(s) used and find the best way to optimize and/or cache your reports.
However, I do not want for a moment to suggest that this approach is difficult or laborious. I only want you to understand that it is not a magic bullet, and that a little work can be required. Fortunately, most users (and most report developers) seem to find that the result is well worth the effort.
The Source Data
This report will need six datasets:
- One for the list of countries
- One for the chart – showing the various cost elements associated with sales for a selected country.
- One to populate the list of available years in the parameters pane of the report
- One to populate the list of available months in the parameters pane of the report
- One to return the current year as a default value for the ReportingYear parameter
- One to return the current month as a default value for the ReportingMonth parameter
The code for all of the datasets is shown below.
-- Code.pr_ReportingYear
-- This stored procedure returns all the years for sales in the database

CREATE procedure Code.pr_ReportingYear

AS

SELECTReportingYear
FROMData.CarSalesData
GROUP BYReportingYear
ORDER BYReportingYear

-- Code.pr_ReportingMonth
-- This stored procedure returns all the months for sales in the database

CREATE procedure Code.pr_ReportingMonth

AS

SELECTReportingMonth
FROMData.CarSalesData
GROUP BYReportingMonth
ORDER BYReportingMonth


-- Code.pr_CurrentMonth
-- This stored procedure returns the current month
CREATE procedure Code.pr_CurrentMonth

AS

SELECT MONTH(GETDATE()) AS CurrentMonth


-- Code.pr_CurrentYear
-- This stored procedure returns the current year

CREATE procedure Code.pr_CurrentYear

AS


SELECT YEAR(GETDATE()) AS CurrentYear


-- This stored procedure returns all the countries where there are sales in the database
-- for the selected year up to and and including the selected month
-- This is used by the slicer

CREATE PROCEDURE Code.pr_WD_DynamicCountrySlicer
(
@ReportingYear INT
,@ReportingMonth INT
)

AS
SELECT DISTINCT    CountryName
FROM               Reports.CarSalesData
WHERE              ReportingYear = @ReportingYear
                   AND ReportingMonth <= @ReportingMonth
ORDER BY           CountryName


-- Code.pr_Tablet_SlicerHighlightCountrySalesCosts
-- This stored procedure returns the data for the selected country and time period
-- This is used by the chart

CREATE PROCEDURE [Code].[pr_Tablet_SlicerHighlightCountrySalesCosts]
(
@ReportingYear INT
,@ReportingMonth TINYINT
,@Country VARCHAR(50)
)

AS

SELECT
             SUM(TotalDiscount) AS TotalDiscount
            ,SUM(DeliveryCharge) AS DeliveryCharge
            ,SUM(SpareParts) AS SpareParts
            ,SUM(LaborCost) AS LaborCost
FROM        Reports.CarSalesData
WHERE       ReportingYear = @ReportingYear
            AND ReportingMonth <= @ReportingMonth
            AND CountryName = @Country
GROUP BY    CountryName
Building the Report
Follow these steps to create your report.
- Create a new report and name it Tablet_SlicerHighlight.rdl.
- Add a Data Source that points to the CarSales_Reports_SSC database that you have restored from the backup in the zip file that accompanies this article. Name it CarSales_Reports.
- Add six datasets based on the six stored procedures described a little earlier. They should be:
- DynamicCountrySlicer using the stored procedure Code.pr_WD_DynamicCountrySlicer. SlicerHighlightCountrySales using the stored procedure - Code.pr_Tablet_SlicerHighlightCountry
- Sales. CurrentMonth (a shared datset) using the stored procedure - Code.pr_CurrentMonth.
- CurrentYear (a shared datset) using the stored procedure - Code.pr_CurrentYear.
- ReportingYear (a shared datset) using the stored procedure - Code.pr_ReportingYear.
- ReportingMonth (a shared datset) using the stored procedure - Code.pr_ReportingMonth.
- Verify that creating the datasets has added the following parameters - if not, you need to add them:
- ReportingYear (Integer, visible)
- ReportingMonth (Integer, visible)
- Country (String)
- Right-click on the Country parameter and select Parameter Properties from the context menu.
- In the General pane, set the parameter visibility to Hidden.
- In the Default Values pane select Specify values.
- Click Add and enter United Kingdom as the default value.
- Click OK. Right-click on the ReportingYear parameter and select Parameter Properties from the context menu.
- In the Available Values pane select Get values from a Query.
- Select ReportingYear as the dataset, Value Field and Label Fields.
- In the Default Values pane select Get values from a Query.
- Select CurrentYear as the dataset and Value Field.
- Right-click on the ReportingMonth parameter and select Parameter Properties from the context menu.
- In the Available Values pane select Get values from a Query.
- Select ReportingMonth as the dataset, Value Field and Label Fields.
- In the Default Values pane select Get values from a Query. Select CurrentMonth as the dataset and Value Field.
- Add a table to the report area under the year and month selector, on the left.
- Remove the header row and all columns except one.
- Set the dataset to DynamicCountrySlicer.
- Add the two images SlicerButton1 and SlicerButtonSelected1 from the directory C:\BIWithSSRS\ (assuming that you have downloaded the sample data to this directory).
- Right-click inside the text box in the table and select Expression.
- Enter the following expression: =" " & Fields!CountryName.Value. Set the background image for the text box to the following expression: =IIF(Fields!CountryName.Value = Parameters!Country.Value,"SlicerButtonSelected1","SlicerButton1").
- Add a chart to the report under the first chart.
- Choose the chart type Column.
- Remove both axis titles. Use SlicerHighlightCountrySalesCosts as the dataset.
- Set the chart title to Cost Elements. In the Chart Data pane set the ∑ Values to: TotalDiscount DeliveryCharge SpareParts LaborCost
- Right-click on the horizontal axis and in the vertical axis properties check Hide axis labels and Hide major tick marks.
- Right-click on the vertical axis and set the following vertical axis properties:
- Axis Options => Always include zero => Checked
- Labels => Enable auto-fit => Selected
- Label Font => Font => Arial
- Label Font => Size => 8pt
- Label Font => Bold => Checked
- Label Font => Italic => Checked
- Number => Category => Number
- Number => Decimal places => 0
- Number => Use 1000 separator => Checked
- Major Tick Marks => Hide major tick marks => Checked
- Minor Tick Marks => Hide minor tick marks => Checked
- Line => Line style => None
- Select the chart and in the Chart Properties window select the Berry Palette
- Right-click on the chart and select Chart Properties. Click Border on the left. In the chart border options set the border type to Line. Choose a 2 point Dim Gray border and apply this to the top border only - by clicking on the top line in the preview in the dialog.
- Click OK
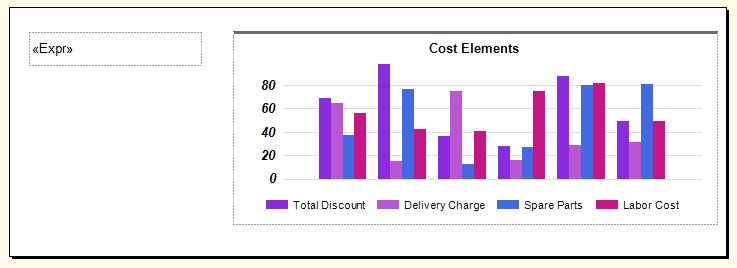
The report should look like the following image:
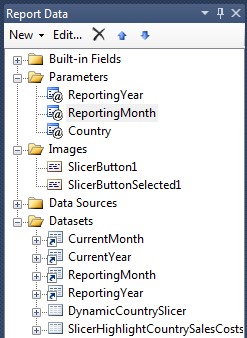
The Report Data pane should look something like this:
You can now preview the report. Each time that you click on an element in the slicer the chart will be updated to show only the data for the selected country. This technique only allows one country to be selected at a time. It is, of course, possible to extend this approach to allow multiple selection, but that is beyond the scope of this article.
How it Works
This report is specifically designed for a tablet. As this is the case we want to enable users to make selections - and see what they have selected - more easily and intuitively. So we are implementing a country selector that resembles an Excel slicer. The "slicer" is dynamic in the sense that it will contain as many elements as there are countries for the selected year and month.
To enhance the visual effect we used two image backgrounds for the text box in the tablix. One is applied if the element is selected, the other is applied to all unselected rows. An expression detects the state (selected or not) and applies the corresponding image. Once a slicer is clicked or tapped the value of the textbox in the tablix is passed to the parameter @country and the report is refreshed (or more precisely, re-opened) using this country as the value that is passed to the stored procedure that selects the data for the chart. The currently selected year and month are also passed back into the report.
There are, of course, ways to mask the year and month parameters too – but that will have to be the subject of another article!
Adam is the author of Business Intelligence with SQL Server Reporting Services – Apress, February 2015, which you can purchase on Amazon