SQL on Hyperv
-
Under the item Parallelism, i have the following settings:
Cost threshold for parallelism = 50
Locks = 0
Max degree of parallelism = 8
Query wait = -1
Note: This is the MAXDOP from the main SQL-settings (top, rightklick, properties, advanced).
You also have a maxdop setting on the database itself, so rightclick the database, properties, options
Max DOP = 0
Max dop for Seconday = empty
In attachment i also have a report of the Waits.
-
new upload
-
Update.
The thirdparty company which provides the software. Has looked into the reports of Brent Ozar sp_Blitz and adjusted all the recommedations within the SQL/SQLsoftware. Great. See what influence this has.
They also made a info note to me about disk'slowness' which i will look into. see attachment. especially Avg.Read Stall (ms)
Then there is still the cpu 'topping' issue. We can not comprehend that the cpu cuts off at 12.5%. spot on 12.5% (the limit?)
- Jo wrote:
Then there is still the cpu 'topping' issue. We can not comprehend that the cpu cuts off at 12.5%. spot on 12.5% (the limit?)
You said you have 8 CPUs. Guess what 100%/8 is?
If your query is running single threaded, it could be using 100% of 1 CPU, which is only 12.5% of the Total CPU capacity.
--Jeff Moden
RBAR is pronounced "ree-bar" and is a "Modenism" for Row-By-Agonizing-Row.
First step towards the paradigm shift of writing Set Based code:
________Stop thinking about what you want to do to a ROW... think, instead, of what you want to do to a COLUMN.Change is inevitable... Change for the better is not.
Helpful Links:
How to post code problems
How to Post Performance Problems
Create a Tally Function (fnTally) -
I agree with Jeff, the applications seems to use a single connection sequentially.
Also, there seem to be a lot of databases on the C-drive which is usually reserved for OS. Any chance to move the databases to another volume so you can isolate OS actions from DB actions volume-level?
Stalls: Anti-virus exclusions are properly set?
-
In reponse to Jo
I agree with Jeff, the applications seems to use a single connection sequentially.
So if i understand correctly, within the software, when they launch a query, the would be saying "launch the query but use 8 processors simultaneously (or multiple connections)"
There is no such a general setting within SQL that you can set, to say, all query's fired on this sql server should use 8 processors simultaneously (or multiple connections)
-
If the program is multiple connections and still only uses one core (12%) it could also be due locking or the way it is programmed.
Consider contacting the vendor about the inner workings (does it work parallel?)
Program:
Connection 1: launch X -> active
Connection 2: launch Y ( Y has to wait on X to end before starting ) -> only one core busy (X)
Connection 3: launch Z ( Z has to wait on Y to start) -> only one core busy (X)
About parallellism and activating multiple cores for one query:
SQL Server has some thresholds to decide if the query could benefit from parallellism and activating multiple processors
Those are mentioned in
https://www.mssqltips.com/sqlservertip/5404/parallelism-in-sql-server-execution-plan/
You can prevent it (by setting maxdop 1)
or force parallellism
- Jo wrote:
In reponse to Jo
I agree with Jeff, the applications seems to use a single connection sequentially.
So if i understand correctly, within the software, when they launch a query, the would be saying "launch the query but use 8 processors simultaneously (or multiple connections)"
There is no such a general setting within SQL that you can set, to say, all query's fired on this sql server should use 8 processors simultaneously (or multiple connections)
Correct and definitely not what I was saying. You can tell SQL what the maximum number of processors to use for a query. You can't tell it what the minimum number of processors to use. If the optimizer estimates that there would be no benefit to any give query running on multiple processors, then it will use only 1 processor for the query.
Getting back to your issue, I'm saying that it looks like you have one proc running at a time and it looks like it's never using more than one processor.
Also, have you checked in the instance settings of SQL Server to see how many processors are actually available to it? Have you checked the MAXDOP server and database settings to ensure that no one has made the mistake of setting any of those settings to MAXDOP 1?
And, yeah... Jo has a link on how to force parallelism. Use with extreme caution and only after some really good testing things can run a whole lot slower after being forced in such a manner and, because you're using more CPUs than you might need, other stuff is having to wait their turn.
--Jeff Moden
RBAR is pronounced "ree-bar" and is a "Modenism" for Row-By-Agonizing-Row.
First step towards the paradigm shift of writing Set Based code:
________Stop thinking about what you want to do to a ROW... think, instead, of what you want to do to a COLUMN.Change is inevitable... Change for the better is not.
Helpful Links:
How to post code problems
How to Post Performance Problems
Create a Tally Function (fnTally) -
Hi Jo,
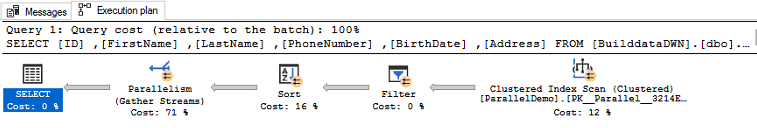
i followed the instructions en tests in your link: https://www.mssqltips.com/sqlservertip/4939/how-to-force-a-parallel-execution-plan-in-sql-server-2016/
If we run the query and we look at the execution plan it stays in "single serial" mode. If we add the command: OPTION (USE HINT ('ENABLE_PARALLEL_PLAN_PREFERENCE')) and we look back at the excution plan then we see its done in parallel. yellow circles with two arrows.

So tests work fine.
What we did next was created the same demo table in the productiondatabase, filled the table and ran the query. Same single serial mode, added the command, and voila its ran in parallel mode.
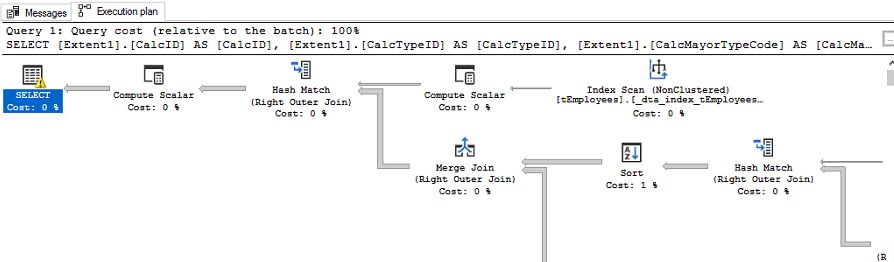
What we then did was take a table from the 3rd party software, searched for a big query. Added the same command: OPTION (USE HINT ('ENABLE_PARALLEL_PLAN_PREFERENCE')), but the thirdparty software keeps going in single serial mode.
So my conclusion is that its within the way of programming or quering in the tirthparty application.
PS. In all my reading i also red that Scalar-valued functions are not recommend to be used and they cannot perform in parralel mode. If i look in the third party application, under Programmability i see a lot of Scalar-valued Functions.
Screenshot of the test "big query from third party application". Where we see it uses Compute Scalar.
-
this looks like a CRM style app - likely doing queries on single entities each time, likely using views on top of views to implement things like row security based on the role/permissions of the user.
If this is the case then slowness will be likely due to the number of functions they likely to use on that as well as the number of joins it needs to do.
it also seems to be using Linq - which can sometimes do very bad sql, mainly on the where clauses. might be good if you could post the full query as well as the explain plan (not in image but the xml itself) - use https://www.brentozar.com/pastetheplan/ for it
-
Hi Frederico,
I have uploaded the query and the explain plan.
https://www.brentozar.com/pastetheplan/?id=r109LVnjs
-
Hi Frederico,
Did you see anything unusual in the query or the explain plan ?
Thanks for the update.
-
sorry too busy at work.
Regarding plan - can you get an ACTUAL explain plan? the one supplied is just an estimated one which does not necessarily reflect the actual execution.
but assuming it does - if this is the query the users are complaining about then, on my opinion, the reason for it is the volume of data - 600k rows (estimated 26 GB data) being returned by that query which in any situation will be a slow process.
but 18 tables being processed with 6 sort operation s (5 are from select distinct - should be looked at) and to the string_agg (4) with a nvarchar(max) output and all of it is contributing to the lack of parallel processing as well as the "slowness".
all of this may also be leading to high memory requests that can't be granted immediately causing some queries to have to wait until there is memory available - the following SQL will give you those details at that point in time - I normally have this inserting into a table running on a SQL Agent job every 10 seconds (on some of my badly behaved servers - MS CRM mainly) so I have both a history of it and so I can then look at the bad queries at a later stage.
main fields on this is the memory requested, memory used and wait_order/wait_time
SELECT
       --Session data
        s.[session_id]
      , s.open_transaction_count

        --Memory usage
      , r.granted_query_memory
      , mg.grant_time
      , mg.requested_memory_kb
      , mg.granted_memory_kb
      , mg.required_memory_kb
      , mg.used_memory_kb
      , mg.max_used_memory_kb
      , mg.wait_order
      , mg.is_next_candidate
      , mg.wait_time_ms

        --Query
      , mg.dop
      , query_text = t.text
      , input_buffer = ib.event_info
      , query_plan_xml = qp.query_plan
      , request_row_count = r.row_count
      , session_row_count = s.row_count

        --Session history and status
      , s.last_request_start_time
      , s.last_request_end_time
      , s.reads
      , s.writes
      , s.logical_reads
      , session_status = s.[status]
      , request_status = r.status

        --Session connection information
      , s.host_name
      , s.program_name
      , s.login_name
      , s.client_interface_name
      , s.is_user_process
FROM sys.dm_exec_sessions s
LEFT OUTER JOIN sys.dm_exec_requests AS r
    ON r.[session_id] = s.[session_id]
LEFT OUTER JOIN sys.dm_exec_query_memory_grants AS mg
    ON mg.[session_id] = s.[session_id]
OUTER APPLY sys.dm_exec_sql_text (r.[sql_handle]) AS t
OUTER APPLY sys.dm_exec_input_buffer(s.[session_id]
      , NULL) AS ib
OUTER APPLY sys.dm_exec_query_plan (r.[plan_handle]) AS qp
WHERE mg.granted_memory_kb > 10000 -- greater than 10 MB requests
ORDER BY mg.granted_memory_kb desc
       , mg.requested_memory_kb desc;
GO
for the parallel there is a trick that may or not work - and may or not improve performance so TEST TEST TEST.
This consists in adding a table with a columnstore index to the main query - with a left outer join so it won't affect the results.
for this particular query you would change the view being used and add the table to the mix.
create table dbo.dummy
(cfield varchar(10)
,ncfield nvarchar(10)
,ifield int
,bigifield int
)
create clustered columnstore index cci_dummy on dbo.dummy
no records on the table


then the joins

select ....
from main tables
left outer join dbo.dummy dmm
on dmm.cfield = main_table.varcharfield
what the above trick may do is to give a push to the QE to use batch mode processing for some tables/joins and a bit of parallel processing.
doesn't always work neither does it always improve performance (both query and overall server) but its easy to test and see impact on both.
-
Hi Frederico,
No problem at all. Thanks for the detailled information. i will pass it to the developpers and see what they can do.
Thanks again.
Viewing 14 posts - 31 through 44 (of 44 total)
You must be logged in to reply to this topic. Login to reply