Select count from a ~big table takes forever and brings the Data IO to 100%
-
I am trying to figure out the reason for a behavior that is not as I expect. I am running some tests on an isolated Azure database Standard-series (Gen5) with 8 cores. I have created +20 million records in a table called [ActivityLog] and I want to start testing my scenarios. To begin with, I have tried to see how many rows exactly I have created so I ran the command below:
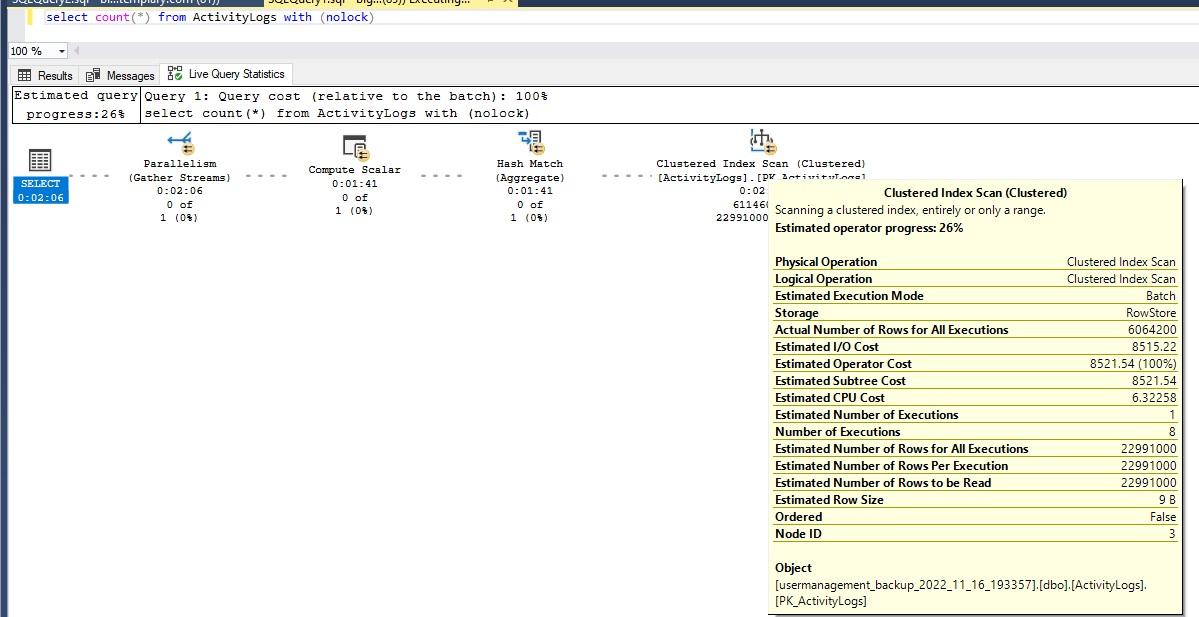
select count(*) from ActivityLog with (nolock)
It took 7:41 minutes for the query to return 22,991,048 rows and the Data IO percentage (Max) jumped to 25% on SSMS.
I ran the same query at the same time on both Azure query editor and SSMS and the Data IO percentage (Max) jumped to 100% and stayed there for about 3 minutes.
I don't understand this. First isn't count something that SQL would keep in statistics?
Then should it take 7 minutes to count the primary indexes?

The script to create my table:
CREATE TABLE [dbo].[ActivityLogs](
[TenantId] [varchar](25) NOT NULL,
[Id] [bigint] NOT NULL,
[CreatedAt] [datetime2](7) NOT NULL,
[CreatedBy] [nvarchar](100) NOT NULL,
[EntityType] [nvarchar](100) NOT NULL,
[OldValue] [nvarchar](max) NULL,
[NewValue] [nvarchar](max) NULL,
[ContextData] [nvarchar](max) NOT NULL,
CONSTRAINT [PK_ActivityLogs] PRIMARY KEY CLUSTERED
(
[TenantId] ASC,
[Id] ASC
)WITH (STATISTICS_NORECOMPUTE = OFF, IGNORE_DUP_KEY = OFF, OPTIMIZE_FOR_SEQUENTIAL_KEY = OFF) ON [PRIMARY]
) ON [PRIMARY] TEXTIMAGE_ON [PRIMARY]
Update:
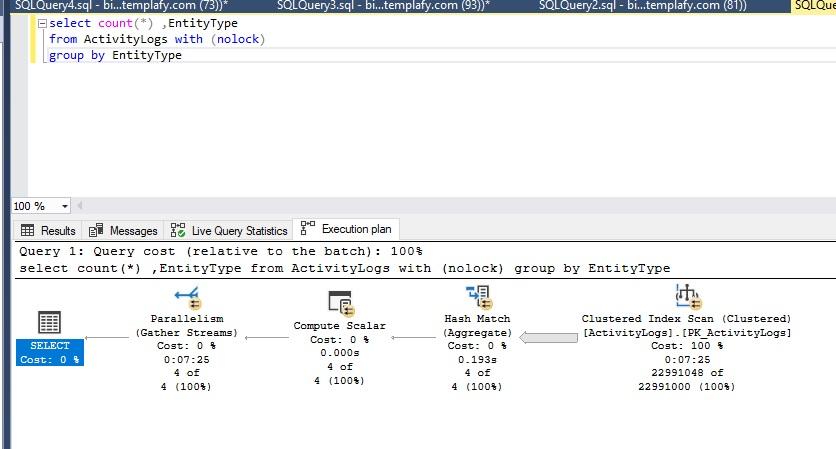
I ran this query containing a field (EntityType) that I don't have any index on. It still ran the same execution plan and took the same time. I don't understand why.
select count(*) ,EntityType
from ActivityLogs with (nolock)
group by EntityType- This topic was modified 3 years, 7 months ago by .
- This topic was modified 3 years, 7 months ago by .
- This topic was modified 3 years, 7 months ago by .
Best Regards,
Ashkan -
For a simple row count, you can query sys.dm_db_partition_stats.
😎
Suggestions:
- Try running the query with option maxdop=1, the cost of parallel execution might be the costliest part of the query.
- An improved table structure is probably the best way to go here, a clustered index on the table could work wonders 😉
-
Hi Eirikur
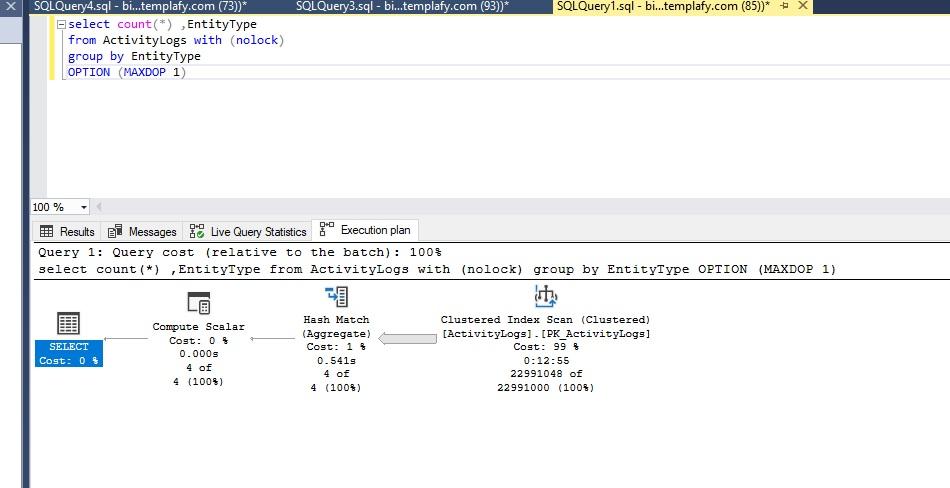
Thanks a lot for the reply. I ran the query with the maxdop 1 as you suggested and I can see that the Data IO percentage (max) dropped to 10% but it took about 13 min to run it. So I guess it didn't help with the time.
select count(*) ,EntityType
from ActivityLogs with (nolock)
group by EntityType
OPTION (MAXDOP 1)
I did not get the second part of the suggestion though. I already have a clustered index which is my primary key (tenantId, id). did you mean that I would change that to be (tenantId, EntityType,id) or something else?
But these aside, I don't understand how can the execution plan of a normal count(*) be the same as when I am grouping on something that is not a part of the index. Is it expected for you?
Best Regards,
Ashkan - ashkan sirous wrote:
I did not get the second part of the suggestion though. I already have a clustered index which is my primary key (tenantId, id). did you mean that I would change that to be (tenantId, EntityType,id) or something else?
Sorry, my bad, I meant a unique clustered index.
😎
Interestingly, it looks like you have been spending 9 years counting 😉
- Eirikur Eiriksson wrote:
Interestingly, it looks like you have been spending 9 years counting 😉
😀 What can I say? If I can't count of how SQL counts, how do I do any other actions? 😛
Best Regards,
Ashkan -
If you are only interested in EntityType, you could use an nonclustered index on it. With a bit luck it only uses this index on one field instead of the larger clustered index. Test first
- ashkan sirous wrote:
I ran this query containing a field (EntityType) that I don't have any index on. It still ran the same execution plan and took the same time. I don't understand why.
select count(*) ,EntityType
from ActivityLogs with (nolock)
group by EntityType
ashkan sirous wrote:Eirikur Eiriksson wrote:Interestingly, it looks like you have been spending 9 years counting 😉
😀 What can I say? If I can't count of how SQL counts, how do I do any other actions? 😛
Your problems are all the same because nothing changed. You're still asking for a Clustered Index Scan of ALL the rows in the table. This type of audit table would never be made to suffer in such a fashion.
Write a query as you would actually expect this "By Column" audit table to be used and properly index for it.
--Jeff Moden
RBAR is pronounced "ree-bar" and is a "Modenism" for Row-By-Agonizing-Row.
First step towards the paradigm shift of writing Set Based code:
________Stop thinking about what you want to do to a ROW... think, instead, of what you want to do to a COLUMN.Change is inevitable... Change for the better is not.
Helpful Links:
How to post code problems
How to Post Performance Problems
Create a Tally Function (fnTally)
Viewing 7 posts - 1 through 7 (of 7 total)
You must be logged in to reply to this topic. Login to reply