Seeking advice on TOP 10 WAITS and their reduction
-
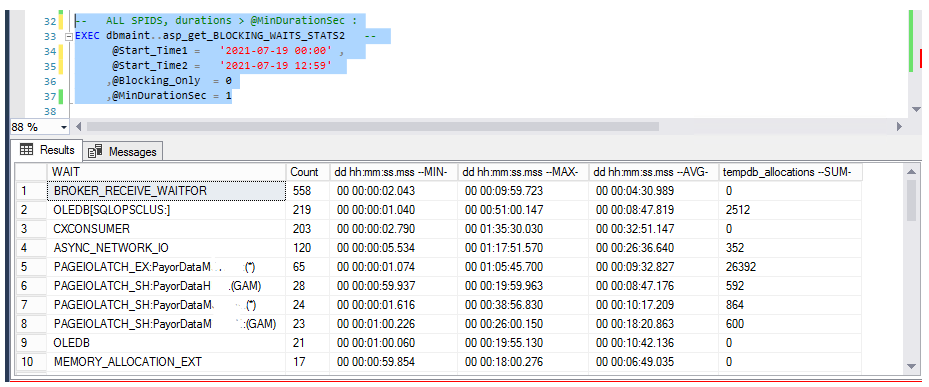
On one of our servers, this is what the top 10 waits look like
(reported on the historical data for SPIDs that have duration over 1 second in the repository based on sp_whoisactive call 1 x minute 24/7 captures).
What should I focus on first and foremost to improve this picture of top waits ? Obviously, those where waits are in minutes may benefit from reducing those durations..

Likes to play Chess
-
Hi VoldemarG,
Do you mind sharing your whole script/store proc? Thanks
-
Looking at those waits, the ones in hours are the ones I would be more concerned about! If I am reading things right on that, the AVERAGE column is showing that ALL of them are lasting at least 4 minutes which seems excessive for waits, and you have CXCONSUMER waits at half an hour on average and 95 minutes as a max. If memory serves, CXCONSUMER is related to parallelism, so fixing that one shouldn't be too complex (increase cost threshold of parallelism).
As for some of the others, the OLEDB ones are related to a linked server if I remember right, so your linked server data pulls are slow. BROKER_RECEIVE_WAITFOR, again, this is from memory, is related to service broker and could be that you configured service broker OR the internal service broker is in use (database mail uses service broker). If you set it up, may not hurt to check its configuration and make sure it is working as you expect.
Now the pageiolatch_ex ones, when those are excessively large, it is usually due to disk IO. See https://social.msdn.microsoft.com/forums/sqlserver/en-US/74cd3ca4-72f0-4699-bf26-945a68fe999e/pageiolatchex-wait-type-on-insert#:~:text=As%20per%20defination%2C%20PAGEIOLATCH_EX%20Occurs%20when%20a%20task,query%20is%20taking%20more%20than%20time%20than%20expected. Specifically the line "As per defination, PAGEIOLATCH_EX Occurs when a task is waiting for a latch for a buffer that is in an I/O request. The latch request is in Exclusive mode. Long waits of this kind indicate a problem with the disk subsystem."
I would investigate which query is slow and try to determine why the query is slow. For example, a query going parallel can cause some odd side effects that hurt performance such as self-blocking or, if your SQL instance is configured to use all cores available to the OS, a thread may not have a CPU to work on if the OS is using that core for some other process. This is where your CXCONSUMER wait type may be coming from. Now, a misconfigured antivirus may also cause some headaches as if it is scanning the database on each change, inserts are going to be horrendously slow.
Now, if wait types are the ONLY thing you want to investigate (note I would investigate the slow queries first and foremost), I would tackle the ones with high MAX time and high AVG time. If the max time exceeds an hour and the average time exceeds 10 minutes, you definitely want to tackle that. Here, I am excluding the first PAGEIOLATCH_EX one because the max time was an hour but the average time is 9 minutes 32 seconds. This is a good wait to correct, but ones that have an average wait of over 30 minutes (CXCONSUMER for example) look like much better candidates to tackle and may be "quick wins".
ALWAYS make sure to test any and all changes on a test system prior to live as you don't want to make things worse. This includes my advice of checking and changing cost threshold for parallelism. That should fix the CXCONSUMER wait type you are seeing, but if misconfigured, may cause other problems in your system. If it is set to 5, it is ALMOST certainly set too low. If it is not set to 5 (the default), someone has already tuned it a bit. Maybe not perfectly, but they have tried and they determined that the value is what it should be set to.
The above is all just my opinion on what you should do.
As with all advice you find on a random internet forum - you shouldn't blindly follow it. Always test on a test server to see if there is negative side effects before making changes to live!
I recommend you NEVER run "random code" you found online on any system you care about UNLESS you understand and can verify the code OR you don't care if the code trashes your system. -
using just min/max/avg will not help much if you have stragglers - you are better off ranking then on durations and then look at the specific ones that are on the higher values.
change your proc to allow a range of min/max duration - and then start on the higher ones and see what else was running at the same time - and what was the CPU and IO at that point - some queries may be well on their own but if your server goes 100% cpu for awhile then ALL queries at that time will get affected - and in this case it may be that you can't really fix the queries (nothing to fix) but you rather need to give more power to the server or change your processes so you have less running.
Networkwaits are just a synonym of high volume of data moving across the network - if these are also associated with parallel processing that may be fine (if parallel is indeed the best for the queries).
on top of the CTFP also look at your MAXDOP - optimal value depends on your server and guidelines you can find on the net (including MS documentation)
-
I have a slightly different take on things... I call the top 10 wait types the "Top 10 symptoms that don't lead you to much" because they are just symptoms and not causes.
I also strongly agree with Frederico above where he says you're better off ranking durations. I'll add that it's even more useful when you rank by durations times the number of runs over a period of time.
You don't actually have to write anything to get such information. With the understanding that they're based on when the last time they were recompiled or the last time cache was cleared, just right click on the instance name in the object explorer, select reports, and follow your nose to the performance reports of I/O and CPU. They even list the top 10 queries that you really should pay attention to.
Waits never hurt anyone or anything... only code can do that. Look at and fix the code... use your top 10 wait stuff to verify that you've actually fixed code.
--Jeff Moden
RBAR is pronounced "ree-bar" and is a "Modenism" for Row-By-Agonizing-Row.
First step towards the paradigm shift of writing Set Based code:
________Stop thinking about what you want to do to a ROW... think, instead, of what you want to do to a COLUMN.Change is inevitable... Change for the better is not.
Helpful Links:
How to post code problems
How to Post Performance Problems
Create a Tally Function (fnTally) -
p.s. Go look for Jonathan Keyhias' code for finding the longest and most prevalent compile times. I once has a 100ms piece of code that ran a couple of tens of thousands of times a day that also took 2 to 22 seconds to compile virtually every time it executed. I got it down to 10ms and the only time it ever recompiled is if it were forced out of cache (very rare for this one or the service has to be restarted for updates (or whatever). I never even look at waits during the whole time I was working on that.
--Jeff Moden
RBAR is pronounced "ree-bar" and is a "Modenism" for Row-By-Agonizing-Row.
First step towards the paradigm shift of writing Set Based code:
________Stop thinking about what you want to do to a ROW... think, instead, of what you want to do to a COLUMN.Change is inevitable... Change for the better is not.
Helpful Links:
How to post code problems
How to Post Performance Problems
Create a Tally Function (fnTally) -
Thank you all for your most valuable responses/comments/advice!
I also want to share here the SP that I created that produced the report shown in the question.
USE [DBMaint]
GO


Create   Proc [dbo].[asp_get_BLOCKING_WAITS_STATS2]
( @Start_Time1 datetime = NULL,
  @Start_Time2 datetime = NULL,
  @Blocking_Only bit = 1,
  @MinDurationSec int = 0)
AS
SET TRANSACTION ISOLATION LEVEL READ UNCOMMITTED
--Authors: Voldemar I.G.,
--           Victor V.B.;
-- contact@SQLExperts.org

--------------------=
-- EXAMPLES OF USAGE:
--------------------=
/*  BLOCKED and BLOCKIng SPIDS ONLY: Tues, June 16:
  EXEC asp_get_BLOCKING_WAITS_STATS2   --
    @Start_Time1 =   '2021-06-15 00:00' ,   @Start_Time2 =   '2021-06-15 23:59' ,    @Blocking_Only = 1
   ,@MinDurationSec = 1

   -- comparing to PREVIOUS Tue, June 08:
   EXEC asp_get_BLOCKING_WAITS_STATS2   --
    @Start_Time1 =   '2021-06-08 00:00' ,   @Start_Time2 =   '2021-06-08 23:59' ,    @Blocking_Only = 1
   ,@MinDurationSec = 1
*/
  /*
EXEC asp_get_BLOCKING_WAITS_STATS2   -- ALL durations, for 1 week:
   @Start_Time1 =   '2021-06-04' ,
   @Start_Time2 =   '2021-06-11' ,
   @Blocking_Only = 0
  ,@MinDurationSec = 1
*/

 -- ONE WEEK, all SPIDs:
/* EXEC asp_get_BLOCKING_WAITS_STATS2  @Start_Time1 =   '2021-03-30' ,
       @Start_Time2 =   '2021-04-06' , @Blocking_Only = 0 */

IF @Start_Time1 is NULL SET @Start_Time1 = (SELECT MIN(Start_time) FROM dbmaint.dbo.WhoIsActiveB)
IF @Start_Time2 is NULL SET @Start_Time2 = (SELECT MAX(Start_time) FROM dbmaint.dbo.WhoIsActiveB)

select
[WAIT],
[Count],
[dd hh:mm:ss.mss --MIN-] ,
[dd hh:mm:ss.mss --MAX-],
CASE WHEN elapsed_time_avg < 0
-- this part is copy/pasted from code generated by sp_WhoIsActive (BEGIN)
THEN RIGHT ( REPLICATE('0', max_elapsed_length) + CONVERT(VARCHAR, (-1 * elapsed_time_avg) / 86400), max_elapsed_length )
+ RIGHT ( CONVERT(VARCHAR, DATEADD(second, (-1 * elapsed_time_avg), 0), 120), 9 )
+ '.000'
ELSE RIGHT ( REPLICATE('0', max_elapsed_length) + CONVERT(VARCHAR, elapsed_time_avg / 86400000), max_elapsed_length )
+ RIGHT ( CONVERT(VARCHAR, DATEADD(second, elapsed_time_avg / 1000, 0), 120), 9 )
+ '.' + RIGHT('000' + CONVERT(VARCHAR, elapsed_time_avg % 1000), 3)
END AS [dd hh:mm:ss.mss --AVG-],
-- copy/pasted from code generated by sp_WhoIsActive (END)
-- elapsed_time_avg,
[tempdb_allocations --SUM-]
from
(select *,
CASE MAX ( LEN ( CONVERT ( VARCHAR,
-- copy/pasted from code generated by sp_WhoIsActive (BEGIN)
CASE WHEN elapsed_time_avg < 0 THEN (-1 * elapsed_time_avg) / 86400 ELSE elapsed_time_avg / 86400000 END
) ) ) OVER ()
WHEN 1 THEN 2
ELSE MAX ( LEN ( CONVERT ( VARCHAR,
CASE WHEN elapsed_time_avg < 0 THEN (-1 * elapsed_time_avg) / 86400 ELSE elapsed_time_avg / 86400000 END
) ) ) OVER () END AS max_elapsed_length
-- copy/pasted from code generated by sp_WhoIsActive (END)
from
(select distinct
[dbo].[RemoveNumericCharacters](  right(wait_info, len(wait_info) - charindex(')', wait_info))) [WAIT],
count(*) [Count],
min([dd hh:mm:ss.mss]) as [dd hh:mm:ss.mss --MIN-] ,
max([dd hh:mm:ss.mss]) as [dd hh:mm:ss.mss --MAX-],
avg(elapsed_time) as elapsed_time_avg,
sum(try_convert(numeric,tempdb_allocations))   as [tempdb_allocations --SUM-]
from
(select *, DATEDIFF_BIG(MILLISECOND, '1970-01-01', ISO8601_date) as elapsed_time
from
(select [dd hh:mm:ss.mss],
'1970-01-' + right('0' + convert(varchar, convert(int, left([dd hh:mm:ss.mss], 2)) + 1), 2)
+ 'T' + right([dd hh:mm:ss.mss], 12) as ISO8601_date,
wait_info,
tempdb_allocations
from dbmaint.dbo.WhoIsActiveB
where (@Blocking_Only = 0 or blocking_session_id is not null)
and wait_info is not null
and start_time between @Start_Time1 and @Start_Time2
) WhoIsActiveB_02
) WhoIsActiveB_03
where elapsed_time >= @MinDurationSec * 1000
group by   [dbo].[RemoveNumericCharacters](  right(wait_info, len(wait_info) - charindex(')', wait_info)))
) WhoIsActiveB_04
) WhoIsActiveB_05
order by [Count] desc
GO
Likes to play Chess
-
NOTES:
table WhoIsActiveB, queried by the above SP for Waits summary is populated via the following call to sp_WhoIsActive every 1 minute:
EXEC sp_WhoIsActive @get_outer_command = 1, @get_plans = 1, @find_block_leaders = 1,
@sort_order = '[blocked_session_count] DESC', @destination_table = 'WhoIsActiveB';
Likes to play Chess
-
this is also one of the major ways I use this SP:
for COMPARISON of several weeks/days/etc: (will also further modify using Federico's guidance above)
--   BLOCKED and BLOCKIng SPIDS ONLY, durations > @MinDurationSec: :
EXEC dbmaint..asp_get_BLOCKING_WAITS_STATS2    --
      @Start_Time1 =   '2021-07-19 00:00'
     ,@Start_Time2 =   '2021-07-19 23:59'
     ,@Blocking_Only  = 1
     ,@MinDurationSec = 1

--   ALL SPIDS, durations > @MinDurationSec :
EXEC dbmaint..asp_get_BLOCKING_WAITS_STATS2   --
      @Start_Time1 =   '2021-07-19 00:00' ,
      @Start_Time2 =   '2021-07-19 12:59'
     ,@Blocking_Only  = 0
     ,@MinDurationSec = 1

--   BLOCKED and BLOCKIng SPIDS ONLY, durations > @MinDurationSec:,
--   YESTERDAY:: SAME TIME PERIOD :
EXEC dbmaint..asp_get_BLOCKING_WAITS_STATS2   --
      @Start_Time1 =   '2021-07-15 00:00' ,
      @Start_Time2 =   '2021-07-15 23:59'
     ,@Blocking_Only  = 1
     ,@MinDurationSec = 1

 EXEC dbmaint..asp_get_BLOCKING_WAITS_STATS2   --
      @Start_Time1 =   '2021-07-15 00:00' ,
      @Start_Time2 =   '2021-07-15 23:59'
     ,@Blocking_Only  = 0
     ,@MinDurationSec = 1
     --  :
--   BLOCKED and BLOCKIng SPIDS ONLY, durations > @MinDurationSec:,
--   ONE WEEK AGO:: SAME TIME PERIOD :
     EXEC dbmaint..asp_get_BLOCKING_WAITS_STATS2   --
      @Start_Time1 =   '2021-07-09 00:00' ,
      @Start_Time2 =   '2021-07-09 23:59'
     ,@Blocking_Only  = 1
     ,@MinDurationSec = 1

--   ALL SPIDS, durations > @MinDurationSec:,
--   ONE WEEK AGO:: SAME TIME PERIOD :
 EXEC dbmaint..asp_get_BLOCKING_WAITS_STATS2   --
      @Start_Time1 =   '2021-07-15 00:00' ,
      @Start_Time2 =   '2021-07-15 23:59'
     ,@Blocking_Only  = 0
     ,@MinDurationSec = 1
--============================================================================================
Likes to play Chess
- VoldemarG wrote:
I also want to share here the SP that I created that produced the report shown in the question.
It seems that you're still concentrating on waits... what have you fixed based on those waits?
--Jeff Moden
RBAR is pronounced "ree-bar" and is a "Modenism" for Row-By-Agonizing-Row.
First step towards the paradigm shift of writing Set Based code:
________Stop thinking about what you want to do to a ROW... think, instead, of what you want to do to a COLUMN.Change is inevitable... Change for the better is not.
Helpful Links:
How to post code problems
How to Post Performance Problems
Create a Tally Function (fnTally) -
One of the things we fixed was analyzing waits: tempDb bottleneck (Allocation Pressure).
Likes to play Chess
-
<<As for some of the others, the OLEDB ones are related to a linked server if I remember right, so your linked server data pulls are slow. BROKER_RECEIVE_WAITFOR, again, this is from memory, is related to service broker and could be that you configured service broker OR the internal service broker is in use (database mail uses service broker). If you set it up, may not hurt to check its configuration and make sure it is working as you expect.>>
Was mentioned above. If you could elaborate more on the last sentence,, how /what can or should we expect?
Likes to play Chess
- VoldemarG wrote:
One of the things we fixed was analyzing waits: tempDb bottleneck (Allocation Pressure).
And how did you fix that?
--Jeff Moden
RBAR is pronounced "ree-bar" and is a "Modenism" for Row-By-Agonizing-Row.
First step towards the paradigm shift of writing Set Based code:
________Stop thinking about what you want to do to a ROW... think, instead, of what you want to do to a COLUMN.Change is inevitable... Change for the better is not.
Helpful Links:
How to post code problems
How to Post Performance Problems
Create a Tally Function (fnTally) -
By adding more files to tempdb!
Likes to play Chess
-
Am i correct in assuming that you didn't actually identify the code that was causing the contention or, if you did, that you spent little time trying to figure out how to fix the code?
I will admit that throwing hardware (additional files) at a TempDB can make for a good Martha Stuart moment when you're in a pinch because you may have to fix a substantial bit of code to fix the contention that it's causing. The trouble is that a lot of people never document the code that was causing the contention. If the contention was based mostly on the number of users running code and not an issue with the code itself, then ok choice. If it only or also based on code issues, then you may have just added to some technical debt. It still wouldn't hurt to find out. You might be able to make a couple of easy, very high ROI changes in just a few places to get rid of a lot of that.
Have you ever tried Brent Ozar's series of "sp_Blitz" code? If not, you should. It could very well be enlightening. I wrote a lot of my own tools that are similar but his is all in a really handy package with a whole lot of goodies. His sp_BlitzWHO code is very similar to one of the ones I wrote and had a couple of extra goodies that I didn't think of. He calls the whole shebang his "First Responder" code and it'll help you a whole lot in determining answers to your original question of "What should I focus on first and foremost " and I'm not just talking about symptoms like the overall number of waits. His stuff will tell you what the code that's causing the waits is and a whole lot more.
Go check it out. Here's the link to download everything and he keeps it up to date.
https://www.brentozar.com/first-aid/
His code is pretty well documented and it's all FREE. He also has a lot of intro documentation on some of the parts at the following link, which is also the GitHub link for all the pieces. It's almost all T-SQL. If nothing else, you can learn a shedload from his code.
https://github.com/BrentOzarULTD/SQL-Server-First-Responder-Kit
This all has reminded me that it's been a while since I've run a lot of my favorites of his code on my production box so thanks for that.
On the "throwing hardware at the problem thing"... sometimes it'll help like your addition of files to TempDB did. Sometimes, it won't be so good. When we upgraded to all SSDs almost 6 years ago, everyone (except me) thought they'd see a 10X improvement in performance. We also went from 128 GB of Ram to 384 and upgraded to some crazy fast CPUs.
Some of the code saw a 2x improvement. Most of it saw no improvement. Some of it actually lost performance.
Yes, you DO need good hardware but the real performance is in the code... heh... or not. We've made changes to a lot of the code where we eliminated hundreds of TB of totally unnecessary IO in the form of Logical Reads and a lot of that code is, indeed, now 10 times faster but we also have substantial amounts of code that we reworked to be 60, 100, 1000, and in a couple of significant cases, 1 to 1.2 MILLION times faster.
And, just to say it again... the worst code isn't usually the longest running code. It's usually on a lot of the small stuff that runs 10 or thousands of times in an hour. Yep, you need to fix the big stuff to0 but choose wisely. As Brent frequently reminds us, user don't give two hoots in hell about CPU, IO, or Memory usage. All they care about is accuracy and duration. Fix the duration (without breaking the accuracy) and CPU, IO, and Memory usage almost always come along for the ride and guess what that means? The waits you're watching will see similar improvements (actually, you may be amazed if you fix the first 10 "worst" queries).
--Jeff Moden
RBAR is pronounced "ree-bar" and is a "Modenism" for Row-By-Agonizing-Row.
First step towards the paradigm shift of writing Set Based code:
________Stop thinking about what you want to do to a ROW... think, instead, of what you want to do to a COLUMN.Change is inevitable... Change for the better is not.
Helpful Links:
How to post code problems
How to Post Performance Problems
Create a Tally Function (fnTally)
Viewing 15 posts - 1 through 15 (of 16 total)
You must be logged in to reply to this topic. Login to reply