Same Execution Plan different stats
- anvegger - Thursday, October 18, 2018 12:41 PM
Actual number of rows may be identical. It's the "rows read" that is the big difference. The D has to read far more rows than the A to get the required number of rows.
There is also differences between the actual vs. estimated almost everywhere.
Try updating statistics on all of the tables.Michael L John
If you assassinate a DBA, would you pull a trigger?
To properly post on a forum:
http://www.sqlservercentral.com/articles/61537/ - Jeffrey Williams 3188 - Thursday, October 18, 2018 12:36 PM
That was also pointed in my post of
SET STATISTICS IO ON;
where all the logical reads were shown. Same counts in stats: but that is not what actual counts are showing from the physical counter - anvegger - Thursday, October 18, 2018 12:41 PM
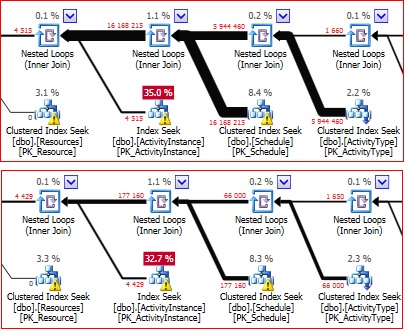
If you look at the plans - this is telling you that the actual number of rows it retrieved from the ActivityInstance is 4515 but it had to 'read' 16168215 to get that result. On the other database the actual rows is 4429 but it only had to read 177160 rows to get that result.
If you further look at the number of rows from Schedule - which is significantly more in D than in A - and consider how many times the index seek is executed on the ActivityInstance table you can see why there are such a high number of reads on each of these tables which will translate to longer execution times.
Jeffrey Williams
“We are all faced with a series of great opportunities brilliantly disguised as impossible situations.”― Charles R. Swindoll
How to post questions to get better answers faster
Managing Transaction Logs - Jeffrey Williams 3188 - Thursday, October 18, 2018 1:15 PM
That is correct: the question is
how
219 209 actual records in Table ActivityInstance have been 'read' 16 168 215 times in one database (Database D) and
217 136 actual records in the same table ActivityInstance have beed 'read' only 177 160 times in the other (Database A) using the same index and similar statistics.I don't see that logic processed from the execution plan.
- anvegger - Thursday, October 18, 2018 1:45 PM
The extra reads are due to the extra records in the Schedule and ActivityType tables

-
Schedule 175982 45016 KB 22904 KB 21928 KB 184 KB
Schedule 179796 46136 KB 23384 KB 22344 KB 408 KBMany thanks for the wonderful picture DesNorton, but again - my actual number of records are increased in a small fraction of total numbers not in many times:
All tables are in a normal grow ratio - 10 % or less, it should not be 50 times slow... in stat that is my concern Or I am thinking in a wrong way totally.
Thanks for your help
-
Let me re-iterate the issue:
1. I have the same INSTANCE running on the virtual box
2. I have two databases restored on that box next to each other
3. I have the same query executed against those two databases producing the same {strange} execution plan
4. The number of rows are slightly different (10% or less)Why do I have in one case that query executed in 2 sec and another case - same query for 115 sec. The bottom line is in may case scenario : a number of logical reads have been increased for a few tables in many times and that is not completely clear to me. Why is that.
Any explanation or a hint on how to improve the query speed time is greatly appreciated.
Thank you all
- anvegger - Thursday, October 18, 2018 3:06 PM
Did you look at Des Norton's reply above? From here, it sounds like you have some accidental many-to-many joins going on. Another name for such thing is "accidental hidden Cross Joins"
--Jeff Moden
RBAR is pronounced "ree-bar" and is a "Modenism" for Row-By-Agonizing-Row.
First step towards the paradigm shift of writing Set Based code:
________Stop thinking about what you want to do to a ROW... think, instead, of what you want to do to a COLUMN.Change is inevitable... Change for the better is not.
Helpful Links:
How to post code problems
How to Post Performance Problems
Create a Tally Function (fnTally) -
That would of been my thought as well but unfortunately I don't see that right in front of my query: everything looks very strait forward - especially the root : INDEX SEEK is not too much of a complication: It all starts from that base: takes that index and reads the number of rows in leaf. But ends in millions of logical reads. and in only one specific case. How about if I DELETE fifty thousand of rows - should that fix the condition of Hidden CROSS APPLY an bring that query back to "normal" fairly identical reads ?
Please advise ... I am running out of my logical thoughts Will test that DELETE statement first thing in the morning. Happy Friday everyone
- anvegger - Thursday, October 18, 2018 4:33 PM
The problem starts with the Schedule table with almost 6 million actual/read rows compared to 66,000 actual/read rows in the other plan. That is 90 times more rows that are read in that plan compared to the other plan.
Since all joins downstream from that are nested loops - the reads on those objects are going to be increased dramatically. Look at the execution plan and see how many times those downstream objects are executed.
It isn't the difference in number of rows in those tables - it is all about the difference in the number of rows in the Schedule table. If that table has nearly the same number of rows in both databases then there must be a deeper issue that is causing more rows to be read and output in the database for plan D.
Jeffrey Williams
“We are all faced with a series of great opportunities brilliantly disguised as impossible situations.”― Charles R. Swindoll
How to post questions to get better answers faster
Managing Transaction Logs - anvegger - Thursday, October 18, 2018 4:33 PM
Doing a DELETE isn't the way to fix this problem. Fixing the code is. And it's not an accidental CROSS APPLY... it's an accidental CROSS JOIN due to a lack of proper criteria.
--Jeff Moden
RBAR is pronounced "ree-bar" and is a "Modenism" for Row-By-Agonizing-Row.
First step towards the paradigm shift of writing Set Based code:
________Stop thinking about what you want to do to a ROW... think, instead, of what you want to do to a COLUMN.Change is inevitable... Change for the better is not.
Helpful Links:
How to post code problems
How to Post Performance Problems
Create a Tally Function (fnTally) - Jeffrey Williams 3188 - Thursday, October 18, 2018 5:38 PM
Precisely: The number of rows are within reasonable 10% distance of that table dbo.Schedule : 175982 (Database A) vs 179796 (Database D). There is no explanation why we have 5 + million scans and multi million logical reads from table D.dbo.Schedule that only has 179796 rows properly clustered . Thanks for noticing
- Jeff Moden - Thursday, October 18, 2018 5:53 PM
Sorry - misstyping : CROSS JOIN I meant ... The query is very simple. There is nothing to be even look at: a half a dozen of tables simply INNER JOIN to produce a zero result set over WHERE clause that filters an un-existing location. I am lost and my brain stopped working
- anvegger - Wednesday, October 17, 2018 1:21 PM
- anvegger - Thursday, October 18, 2018 2:58 PM
Viewing 15 posts - 16 through 30 (of 49 total)
You must be logged in to reply to this topic. Login to reply