Performance improves after reboot

  • Kevin,
    May I please ask you to clarify some of your your comments.

    1) Any time I see nvarchar(4000) parameters I think ORM, mismatched data types, and a butt-ton of CONVERT_IMPLICITs with their correspondingly horrible performance and concurrency issues.
    What are you talking about?
    What nvarchar(4000) parameters ?

    2) You clearly have repeated complete buffer flushes. That's brutal.
    How did you find it out?
    If that's the case, what is the impact on performance?
    How to find out what's causing buffer flushes?

    3) Solarwinds is aggregating all IO stalls into 15 minute buckets. Your graphs just show latency, not how many things were running concurrently and collecting fileIO stalls. Just yesterday I captured a 180 SECOND run of IO stalls on a client and they totaled a mind-blowing 2.5 MILLION MILLISECONDS in duration!!! That is 28.94 DAYS of IO stalls in 180 clock seconds!! Guess what, you can't run almost 2TB of BUSY and REALLY BADLY DESIGNED AND CODED OLTP databases with 2 synchronous AGs for each database on a four 6-disk RAID10 sets.

    Are you referring to your client's case?
    Ours is not 2TB, it's 3TB OLTP database.
    I also have no clue what disks we use.
    All I know it's SAN storage. Nimble system.

  • RVO - Friday, February 24, 2017 10:06 PM

    Kevin,
    May I please ask you to clarify some of your your comments.

    1) Any time I see nvarchar(4000) parameters I think ORM, mismatched data types, and a butt-ton of CONVERT_IMPLICITs with their correspondingly horrible performance and concurrency issues.
    What are you talking about?
    What nvarchar(4000) parameters ?

    2) You clearly have repeated complete buffer flushes. That's brutal.
    How did you find it out?
    If that's the case, what is the impact on performance?
    How to find out what's causing buffer flushes?

    3) Solarwinds is aggregating all IO stalls into 15 minute buckets. Your graphs just show latency, not how many things were running concurrently and collecting fileIO stalls. Just yesterday I captured a 180 SECOND run of IO stalls on a client and they totaled a mind-blowing 2.5 MILLION MILLISECONDS in duration!!! That is 28.94 DAYS of IO stalls in 180 clock seconds!! Guess what, you can't run almost 2TB of BUSY and REALLY BADLY DESIGNED AND CODED OLTP databases with 2 synchronous AGs for each database on a four 6-disk RAID10 sets.

    Are you referring to your client's case?
    Ours is not 2TB, it's 3TB OLTP database.
    I also have no clue what disks we use.
    All I know it's SAN storage. Nimble system.

    1) I saw nvarchar parameters in the queries of the picture you posted

    2) PLE dropping to zero quickly is the indication of buffer pool flush. Performance is affected because all the active data has to be read back into memory. Find cause by query monitoring and finding huge queries and/or huge memory grants. 

    3) Referring to my client

    Best,
    Kevin G. Boles
    SQL Server Consultant
    SQL MVP 2007-2012
    TheSQLGuru on googles mail service

  • TheSQLGuru - Saturday, February 25, 2017 8:56 AM

    RVO - Friday, February 24, 2017 10:06 PM

    Kevin,
    May I please ask you to clarify some of your your comments.

    1) Any time I see nvarchar(4000) parameters I think ORM, mismatched data types, and a butt-ton of CONVERT_IMPLICITs with their correspondingly horrible performance and concurrency issues.
    What are you talking about?
    What nvarchar(4000) parameters ?

    2) You clearly have repeated complete buffer flushes. That's brutal.
    How did you find it out?
    If that's the case, what is the impact on performance?
    How to find out what's causing buffer flushes?

    3) Solarwinds is aggregating all IO stalls into 15 minute buckets. Your graphs just show latency, not how many things were running concurrently and collecting fileIO stalls. Just yesterday I captured a 180 SECOND run of IO stalls on a client and they totaled a mind-blowing 2.5 MILLION MILLISECONDS in duration!!! That is 28.94 DAYS of IO stalls in 180 clock seconds!! Guess what, you can't run almost 2TB of BUSY and REALLY BADLY DESIGNED AND CODED OLTP databases with 2 synchronous AGs for each database on a four 6-disk RAID10 sets.

    Are you referring to your client's case?
    Ours is not 2TB, it's 3TB OLTP database.
    I also have no clue what disks we use.
    All I know it's SAN storage. Nimble system.

    1) I saw nvarchar parameters in the queries of the picture you posted

    2) PLE dropping to zero quickly is the indication of buffer pool flush. Performance is affected because all the active data has to be read back into memory. Find cause by query monitoring and finding huge queries and/or huge memory grants. 

    3) Referring to my client

    Thanks Kevin.
    1) that was a piece from Microsoft system procedure "msdb.dbo.sp_help_schedule"  . . .  @ClientIP nvarchar(50)
    Nothing we can do about it.

  • I noticed 
    SQL Full-text Filter Daemon Launcher (MSSQLSERVER) service is running on that machine.
    Do we need it? What is it?
    I'm afraid somebody just accidently started it.

  • RVO - Saturday, February 25, 2017 7:20 PM

    TheSQLGuru - Saturday, February 25, 2017 8:56 AM

    RVO - Friday, February 24, 2017 10:06 PM

    Kevin,
    May I please ask you to clarify some of your your comments.

    1) Any time I see nvarchar(4000) parameters I think ORM, mismatched data types, and a butt-ton of CONVERT_IMPLICITs with their correspondingly horrible performance and concurrency issues.
    What are you talking about?
    What nvarchar(4000) parameters ?

    2) You clearly have repeated complete buffer flushes. That's brutal.
    How did you find it out?
    If that's the case, what is the impact on performance?
    How to find out what's causing buffer flushes?

    3) Solarwinds is aggregating all IO stalls into 15 minute buckets. Your graphs just show latency, not how many things were running concurrently and collecting fileIO stalls. Just yesterday I captured a 180 SECOND run of IO stalls on a client and they totaled a mind-blowing 2.5 MILLION MILLISECONDS in duration!!! That is 28.94 DAYS of IO stalls in 180 clock seconds!! Guess what, you can't run almost 2TB of BUSY and REALLY BADLY DESIGNED AND CODED OLTP databases with 2 synchronous AGs for each database on a four 6-disk RAID10 sets.

    Are you referring to your client's case?
    Ours is not 2TB, it's 3TB OLTP database.
    I also have no clue what disks we use.
    All I know it's SAN storage. Nimble system.

    1) I saw nvarchar parameters in the queries of the picture you posted

    2) PLE dropping to zero quickly is the indication of buffer pool flush. Performance is affected because all the active data has to be read back into memory. Find cause by query monitoring and finding huge queries and/or huge memory grants. 

    3) Referring to my client

    Thanks Kevin.
    1) that was a piece from Microsoft system procedure "msdb.dbo.sp_help_schedule"  . . .  @ClientIP nvarchar(50)
    Nothing we can do about it.

    Sadly Microsoft's developers use horrible design and coding practices too, just like every other client I have engaged with. Just yesterday I got smacked with a crushing set of queries fired off at a client by SSMS that had a slew of Nvarchar badness in them (PLUS iterative RBAR queries). Completely horrified to find that SSMS is apparently coded with Entity Framework using the DISASTROUS default crap it has in it.

    Best,
    Kevin G. Boles
    SQL Server Consultant
    SQL MVP 2007-2012
    TheSQLGuru on googles mail service

  • RVO - Saturday, February 25, 2017 8:49 PM

    I noticed 
    SQL Full-text Filter Daemon Launcher (MSSQLSERVER) service is running on that machine.
    Do we need it? What is it?
    I'm afraid somebody just accidently started it.

    Full Text Daemon is pretty small footprint and if your databases don't have any full text stuff set up it won't do any harm. There are ways you can check if you have FTS in play using DMVs and/or system objects. I honestly don't think I would bother with it.

    I note that if you DO have it in play it is definitely an area you can screw up and abuse to your detriment. RTFM!!!

    Best,
    Kevin G. Boles
    SQL Server Consultant
    SQL MVP 2007-2012
    TheSQLGuru on googles mail service

  • Hi guys,

    Today we have big problems with Availability Group (AG) synchronization.
    Secondary cannot catch up with Primary.
    It prevents Transaction Log Truncate to do the work.
    Transaction Log has been growing from 160 GB to 200 GB since yesterday.
    We noticed increate in Transaction/sec in SOLARWINDS.
    CPU is starting to go up slowly in the last two days.
    Now I start to think maybe the last time when performance problem occurred
    AG slowness was the problem ? We just didn't know where to look?

    On Secondary server
    people reported error:

    Executingthe query . . . . .

    failed with the following error:"Database 'XXXXX' cannot be opened due to inaccessible files or insufficient memory or disk space.

  • RVO - Monday, February 27, 2017 2:57 PM

    Hi guys,

    Today we have big problems with Availability Group (AG) synchronization.
    Secondary cannot catch up with Primary.
    It prevents Transaction Log Truncate to do the work.
    Transaction Log has been growing from 160 GB to 200 GB since yesterday.
    We noticed increate in Transaction/sec in SOLARWINDS.
    CPU is starting to go up slowly in the last two days.
    Now I start to think maybe the last time when performance problem occurred
    AG slowness was the problem ? We just didn't know where to look?

    On Secondary server
    people reported error:

    Executingthe query . . . . .

    failed with the following error:"Database 'XXXXX' cannot be opened due to inaccessible files or insufficient memory or disk space.

    Well, the most obvious thing would to be to check the memory and free space on the server.  If memory is maxed out or your drives are full, that would be your problem...  I will assume you checked those things already.  

    If those look good from the OS on the server itself, you should then check from the host side of things.  Make sure that memory and especially disk aren't over-allocated on the host.  There are a couple of ways this can happen...  soft partitioning, data snapshots, etc...  that can make it look like you have plenty of space on the server itself (what the OS sees) when you're actually out of space on the physical host.  Your hardware people will need to look into this.

    If you have adequate space in both memory and drive...  the other possibility is that you have data corruption.  Try doing a checkdb and see if that shows anything specific...

    Frankly, given this new information I suspect even more-so than before that your underlying issue is hardware.

  • RVO - Monday, February 27, 2017 2:57 PM

    Hi guys,

    Today we have big problems with Availability Group (AG) synchronization.
    Secondary cannot catch up with Primary.
    It prevents Transaction Log Truncate to do the work.
    Transaction Log has been growing from 160 GB to 200 GB since yesterday.
    We noticed increate in Transaction/sec in SOLARWINDS.
    CPU is starting to go up slowly in the last two days.
    Now I start to think maybe the last time when performance problem occurred
    AG slowness was the problem ? We just didn't know where to look?

    On Secondary server
    people reported error:

    Executingthe query . . . . .

    failed with the following error:"Database 'XXXXX' cannot be opened due to inaccessible files or insufficient memory or disk space.

    There are a LOT of reasons why mirroring gets behind. 

    Note that if you don't do something about the tlog size (which is full of data) and you have an outage and need to restore it could take a VERY long time to recover the database, thus affecting your ability to meet your outage/recovery requirements.

    Best,
    Kevin G. Boles
    SQL Server Consultant
    SQL MVP 2007-2012
    TheSQLGuru on googles mail service

  • RVO - Tuesday, February 21, 2017 1:03 PM

    We just had a meeting with Infrastructure team.
    They say there is no evidence of "main resources throttled or yanked out from under them".
    They say they monitor it. It never happened.
    If I still insist - it will sound like I don't trust them . . .

    We have been hit by the balloon driver many times even though the company that looks after our hardware swore that they never over commit resources. After months of begging I finally got access to the VMWare console and saw for myself that it was the balloon driver causing the issue so we now make memory reservation part of the standard build for production servers. I have lost access to the console again now but recently noticed some VMWare counters in Perfmon e.g. [VM Memory - Memory Ballooned in MB] so if you have access to the OS you could try keeping an eye on those. There are ones for VM processor as well e.g. [VM Processor - CPU Stolen Time]

    Another thing that we have suffered from in the virtual world is DRS causing server migrations and it seems to pick the busy server to migrate for some reason rather than moving off the more lightly loaded VM's.

  • TheSQLGuru - Monday, February 27, 2017 6:07 PM

    RVO - Monday, February 27, 2017 2:57 PM

    Hi guys,

    Today we have big problems with Availability Group (AG) synchronization.
    Secondary cannot catch up with Primary.
    It prevents Transaction Log Truncate to do the work.
    Transaction Log has been growing from 160 GB to 200 GB since yesterday.
    We noticed increate in Transaction/sec in SOLARWINDS.
    CPU is starting to go up slowly in the last two days.
    Now I start to think maybe the last time when performance problem occurred
    AG slowness was the problem ? We just didn't know where to look?

    On Secondary server
    people reported error:

    Executingthe query . . . . .

    failed with the following error:"Database 'XXXXX' cannot be opened due to inaccessible files or insufficient memory or disk space.

    There are a LOT of reasons why mirroring gets behind. 

    Note that if you don't do something about the tlog size (which is full of data) and you have an outage and need to restore it could take a VERY long time to recover the database, thus affecting your ability to meet your outage/recovery requirements.

    Kevin,

    What can I do about TLOG size ?

  • Anybody knows how to check
    how badly mirroring is behind?
    Any scripts?

  • I can't help there.  Won't even try to make an educated guess because I don't use Mirrors or AG.

    --Jeff Moden


    RBAR is pronounced "ree-bar" and is a "Modenism" for Row-By-Agonizing-Row.
    First step towards the paradigm shift of writing Set Based code:
    ________Stop thinking about what you want to do to a ROW... think, instead, of what you want to do to a COLUMN.

    Change is inevitable... Change for the better is not.


    Helpful Links:
    How to post code problems
    How to Post Performance Problems
    Create a Tally Function (fnTally)

  • Here ya go:

    SELECT --HAGS.group_id ,
            HAGS.primary_replica ,
           HAGS.primary_recovery_health ,
            HAGS.primary_recovery_health_desc ,
           HAGS.secondary_recovery_health ,
           HAGS.secondary_recovery_health_desc ,
           HAGS.synchronization_health ,
            HAGS.synchronization_health_desc ,
          -- AGS.group_id ,
            AGS.name ,
           AGS.resource_id ,
           AGS.resource_group_id ,
            AGS.failure_condition_level ,
            AGS.health_check_timeout ,
            AGS.automated_backup_preference ,
            AGS.automated_backup_preference_desc
    FROM    sys.dm_hadr_availability_group_states HAGS
            INNER JOIN sys.availability_groups AGS ON HAGS.group_id = AGS.group_id

    SELECT  AGS.name AS AGGroupName ,
            AR.replica_server_name AS InstanceName ,
            HARS.role_desc ,
            DB_NAME(DRS.database_id) AS DBName ,
            DRS.database_id ,
            AR.availability_mode_desc AS SyncMode ,
            DRS.synchronization_state_desc AS SyncState ,
            DRS.last_hardened_lsn ,
            DRS.end_of_log_lsn ,
            DRS.last_redone_lsn ,
            DRS.last_hardened_time ,
            DRS.last_redone_time ,
            DRS.log_send_queue_size ,
            DRS.redo_queue_size
    FROM    sys.dm_hadr_database_replica_states DRS
            LEFT JOIN sys.availability_replicas AR ON DRS.replica_id = AR.replica_id
            LEFT JOIN sys.availability_groups AGS ON AR.group_id = AGS.group_id
            LEFT JOIN sys.dm_hadr_availability_replica_states HARS ON AR.group_id = HARS.group_id
                                                                  AND AR.replica_id = HARS.replica_id
    ORDER BY AGS.name ,
            AR.replica_server_name ,
            DB_NAME(DRS.database_id)

    Wkr,
    Eddy

  • Van Heghe Eddy - Wednesday, March 1, 2017 5:18 AM

    Here ya go:

    SELECT --HAGS.group_id ,
            HAGS.primary_replica ,
           HAGS.primary_recovery_health ,
            HAGS.primary_recovery_health_desc ,
           HAGS.secondary_recovery_health ,
           HAGS.secondary_recovery_health_desc ,
           HAGS.synchronization_health ,
            HAGS.synchronization_health_desc ,
          -- AGS.group_id ,
            AGS.name ,
           AGS.resource_id ,
           AGS.resource_group_id ,
            AGS.failure_condition_level ,
            AGS.health_check_timeout ,
            AGS.automated_backup_preference ,
            AGS.automated_backup_preference_desc
    FROM    sys.dm_hadr_availability_group_states HAGS
            INNER JOIN sys.availability_groups AGS ON HAGS.group_id = AGS.group_id

    SELECT  AGS.name AS AGGroupName ,
            AR.replica_server_name AS InstanceName ,
            HARS.role_desc ,
            DB_NAME(DRS.database_id) AS DBName ,
            DRS.database_id ,
            AR.availability_mode_desc AS SyncMode ,
            DRS.synchronization_state_desc AS SyncState ,
            DRS.last_hardened_lsn ,
            DRS.end_of_log_lsn ,
            DRS.last_redone_lsn ,
            DRS.last_hardened_time ,
            DRS.last_redone_time ,
            DRS.log_send_queue_size ,
            DRS.redo_queue_size
    FROM    sys.dm_hadr_database_replica_states DRS
            LEFT JOIN sys.availability_replicas AR ON DRS.replica_id = AR.replica_id
            LEFT JOIN sys.availability_groups AGS ON AR.group_id = AGS.group_id
            LEFT JOIN sys.dm_hadr_availability_replica_states HARS ON AR.group_id = HARS.group_id
                                                                  AND AR.replica_id = HARS.replica_id
    ORDER BY AGS.name ,
            AR.replica_server_name ,
            DB_NAME(DRS.database_id)

    Wkr,
    Eddy

    Thank you very much, Van Heghe Eddy !
    Your scripts did not render nicely
    but if I'm correct there are two scripts.
    First one didn't work for me
    I probably don't have permissions to access
    sys.availability_groups

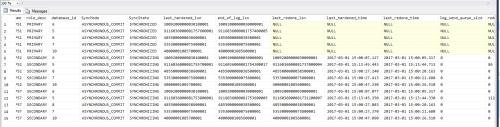
    But the second script worked.
    Results below
    Can you please teach me how make sense out of it?
    What does it tell me?
    How can I tell from it if it's getting behind. how badly behind . . . 

    FIG 1

Viewing 15 posts - 91 through 105 (of 114 total)

You must be logged in to reply to this topic. Login to reply