Page Life Expectancy Maximum On NUMA Nodes?
-
I have a physical server running SQL 2016 (13.0.5216.0) Enterprise Edition with 2 sockets and 28 cores. Memory is 271gb with 235 allocated to SQL split into two NUMA nodes. Data is stored on SSD drives. There server is involved with several availability groups as both a primary and secondary replica. The server is also a replication publisher.
The server usage is almost entirely OLTP with 3-5 million new records being created daily in about a dozen different databases. The total size of the databases is measured in terabytes but that is data for more than ten years and the vast bulk of active data being queried is for the most recent couple of months.
For several month, I have noticing that PLE drops every dramatically every 50-80 mins - often to zero. There appears to be no performance impact that I can detect; the data and plan cache don't change any more during the drop than they do at any other time, there are no major queries that can be correlated to the PLE plunges either and IO is also relatively static with no spikes that can be aligned with the changes in PLE.
I have been pretty much ignoring this behavior and regarding as some kind of anomaly regarding the PLE count. The PLE is being recorded every 5 minutes and has never exceeded 7500.
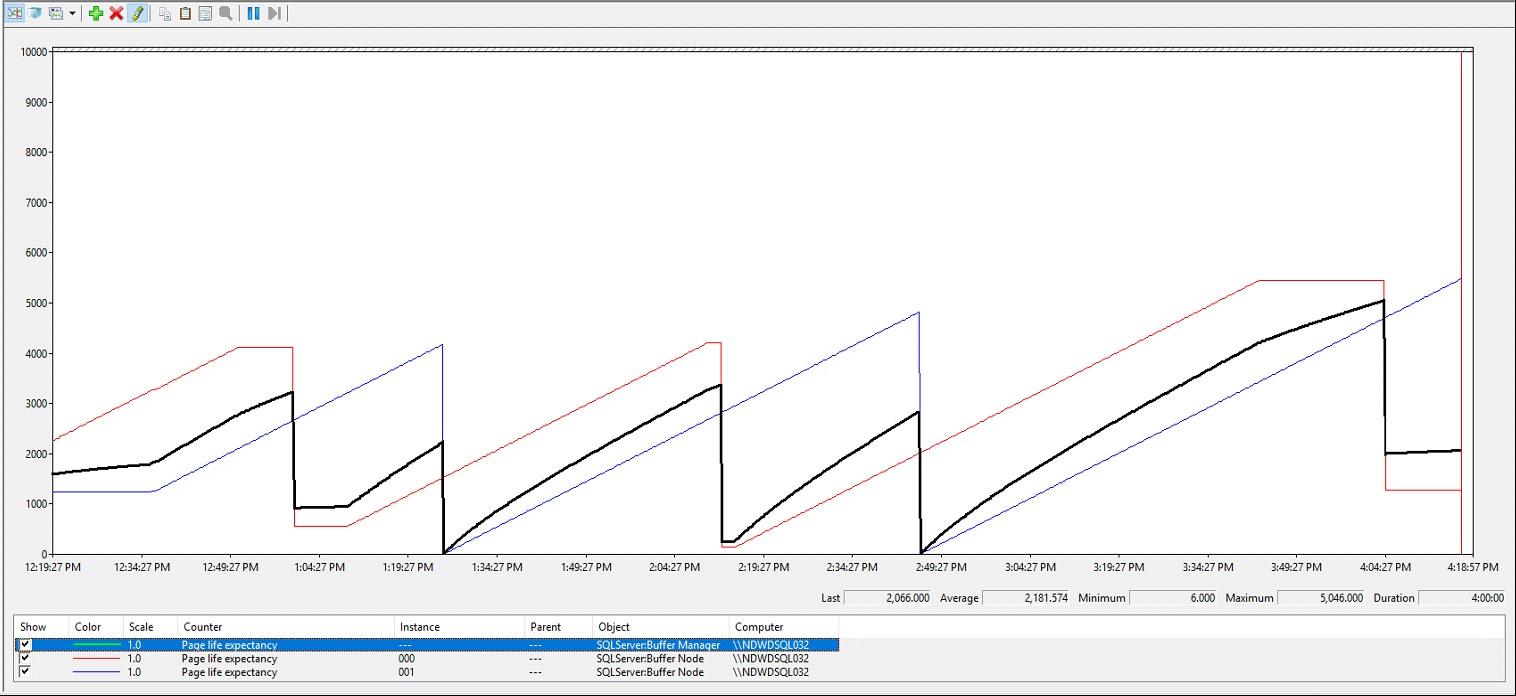
The other day, I dug a little deeper into PLE by NUMA mode and found one node appears to establish a ceiling of some kind and PLE for that node remains constant for an extended period - sometimes for close to an hour. The value for this 'ceiling' changes each time it occurs and has varied from 1000-6000 seconds. When the PLE for the other node gets to a few minutes of this ceiling, it plunges dramatically and starts climbing back up and repeating the cycle.
The screenshot below show this pattern over a 4 hour period. The black line is the overall page life expectancy and the other two like are the PLE for each node.
Now it may just be that the data cache is far more volatile than I think it but, other than PLE, there is no evidence of significant memory pressure that the average data page can't stay in cache longer than 90 minutes.
Has anyone got a good explanation for this behavior?

-
Do you know what is running at the times that the sudden drops in PLE occur? PLE doesn't really have a maximum, and doesn't drop unexpectedly unless there are queries with high number of reads running, or some external process is taking memory away from SQL Server.
-
I have run a profiler trace to capture any query with more than 1,000,000 reads and have captured a number of them but none of the run times are anywhere near the PLE drop times.
This is a dedicated SQL server with nothing else running on it. I have had PerfMon running with the counters for SQL Target and Total Pages and they don't even dip when PLE drops so it does not appear that SQL memory is being reduced at any point.
Also, if memory was being taken from SQL, would both NUMA nodes be impacted rather than just one? Wouldn't this also apply to large amounts of data being read into the buffer?
Other than the PLE drops, there are no other indications of memory pressure so am left with something being wrong with the PLE counter but have never encountered this before.
Viewing 3 posts - 1 through 3 (of 3 total)
You must be logged in to reply to this topic. Login to reply