How to increase performance to load a factless date-date-interval table
-
Hi all,
I am currently having performance issues by populating one of my factless fact tables (fact_Datum). My business relevant fact table is not point-in-time but time-interval-based, because I am dealing with the whole history of the customer. Because we have use cases to analyse the data point-in-time, I have modelled that in the following way:
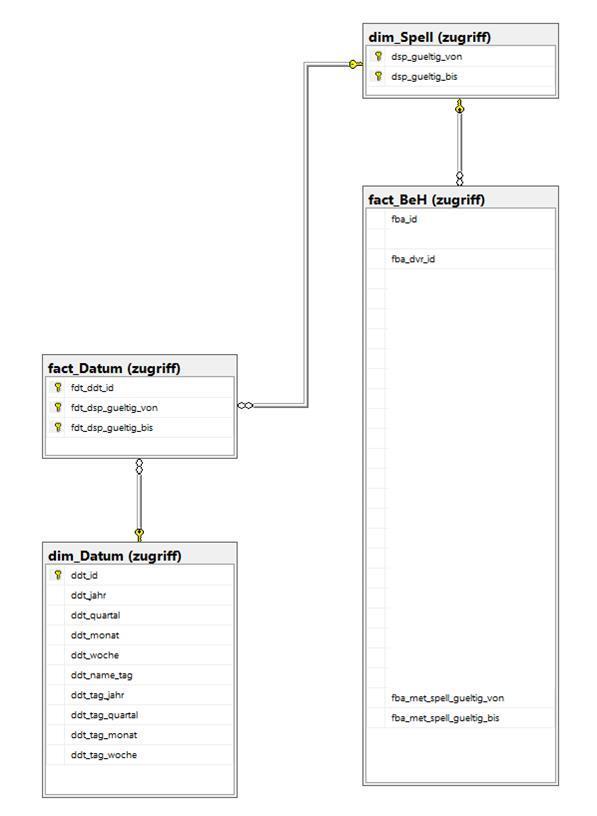
- fact_BeH: my business time-interval based fact table (valid from column name: fba_met_spell_gueltig_von / valid to column name: fba_met_spell_gueltig_bis)
- dim_Datum: table storing all calendar dates (ddt_id partitioned by years)
- dim_Spell: storing all the time intervals used in the fact table fact_BeH (dsp_gueltig_von partitioned by years)
- fact_Datum: m:n factless fact table translating which date refers to which time interval and wich dates are within one time interval (fdt_ddt_id by years)
As both fact tables as well as dim_Spell can get quite big, I am using a yearly based partitioning as typical use cases only focuses on 1-2 year periods or point in time request. I want to avoid full table/index scans to just select a slice. Further, all tables are stored in clustered column store index with additional constraints on top of it (primary keys, uniques, foreign keys).
Here is a screenshot of the data model:

As I started with "small" data, I used the following query to load "fact_Datum":
SELECT fdt_ddt_id = ddt.ddt_id,
       fdt_dsp_gueltig_von = dsp.dsp_gueltig_von,
       fdt_dsp_gueltig_bis = dsp.dsp_gueltig_bis
FROM   zugriff.dim_spell AS dsp WITH (nolock, INDEX(pk_dim_spell))
       INNER JOIN zugriff.dim_datum AS ddt WITH (nolock)
               ON ddt.ddt_id >= dsp.dsp_gueltig_von
                  AND ddt.ddt_id <= dsp.dsp_gueltig_bis
This worked fine until now as the expected set of fact_Datum would increase to 10 billion records. After 10 hours the query didn't finish, so I optimised the query to limit the data access to the relevant partitions, i.e. instead of scanning for all dates all date intervals I focus to a specific year and looped over all years (the target table is without constraints to allow minimal logging):
DECLARE @cnt INT = 2;WHILE @cnt <= 52

BEGIN
  PRINT 'Processing year ' + Cast(1968 + @cnt AS CHAR(255));

  INSERT INTO zugriff.fact_datum WITH (tablock)
  SELECT     fdt_ddt_id =          ddt.ddt_id,
             fdt_dsp_gueltig_von = dsp.dsp_gueltig_von,
             fdt_dsp_gueltig_bis = dsp.dsp_gueltig_bis
  FROM       zugriff.dim_spell     AS dsp WITH (nolock, INDEX(pk_dim_spell))

  INNER JOIN zugriff.dim_datum     AS ddt WITH (nolock)
  ON         ddt.ddt_id >= dsp.dsp_gueltig_von
  AND        ddt.ddt_id <= dsp.dsp_gueltig_bis

  WHERE      $partition.Partitioningbydate(ddt.ddt_id) >= @cnt
  AND        $partition.Partitioningbydate(dsp.dsp_gueltig_von) = @cnt

  SET @cnt = @cnt + 1;
END;
The query finished after 6 hours but it is so much time for such a trivial transformation.
So, I thought about it and I do not need the dim_Datum table to build the result set fact_Datum but only the dim_Spell, as all information is available. Here is an example what I mean:
I "just" need to "unfold" the set based on the left and right date interval, i.e. something like subfield in Oracle which "transpose" the data but in this case to increase the left date interval until the right interval is reached.
I do not know how to do that in T-SQL, even if this is faster than the second query.
Do you have any ideas?
Thanks for reading and helping out!
-
Thanks for posting your issue and hopefully someone will answer soon.
This is an automated bump to increase visibility of your question.
-
Can you clarify what you mean by this part?
I "just" need to "unfold" the set based on the left and right date interval, i.e. something like subfield in Oracle which "transpose" the data but in this case to increase the left date interval until the right interval is reached.
Are you asking how to get from this (for example):
(2021-01-01, 2021-01-03)
to this
2021-01-01
2021-01-02
2021-01-03
?
-
Or this? (Pipe is being used to indicate a separate column for each date)
2021-01-01 | 2021-01-02 | 2021-01-03 ...
--Jeff Moden
RBAR is pronounced "ree-bar" and is a "Modenism" for Row-By-Agonizing-Row.
First step towards the paradigm shift of writing Set Based code:
________Stop thinking about what you want to do to a ROW... think, instead, of what you want to do to a COLUMN.Change is inevitable... Change for the better is not.
Helpful Links:
How to post code problems
How to Post Performance Problems
Create a Tally Function (fnTally) -
Hi,
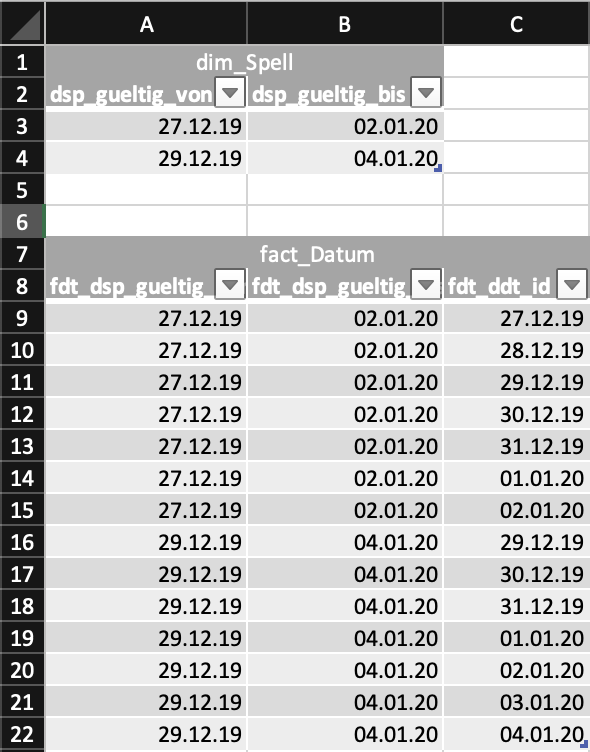
thanks for your answers. What I mean is what Phil Parkin describes or what you see in my Excel screenshot.
- For each row there is a left and a right boundary of dates
- Each row must be expanded to cover all days between the left and right boundary including the boundaries themselves
- Input colums must be present in the output, i.e. left boundary, right boundary, single day as element in the boundaries
Example:
- Input: 2021-01-01, 2021-01-03
- Output:
- 2021-01-01, 2021-01-03, 2021-01-01
- 2021-01-01, 2021-01-03, 2021-01-02
- 2021-01-01, 2021-01-03, 2021-01-03
Do you have a performant SQL query to achieve that?
Thanks!
-
I would query why that is a requirement - in a properly designed cube a good analysis tool that can accomplished that within the tool (SSAS or similar) using their own functions without the need to expand it.
regardless - is your data prone to change past values? if not then doing the "newer" should be a lot faster - and you should not need to change old values and they should/could then be excluded from processing.
- svenflock wrote:
Do you have a performant SQL query to achieve that?
I hope the translator is working correctly but, to answer the question above, "Ja. Und es'ist blitzschnell! "
First, I have to say that I agree with Frederico above. Relational multiplication like this can lead to huge processing resources used. It's easy to and super fast to do the relational multiplication but what that gets used for usually is not.
Here's a super easy and nasty fast way to do what you ask according to your Excel screenshot. Do read the comments in the code. Note that I also seriously question the use of 2 digit years and non-ISO dates.
SET DATEFORMAT DMY
;
--===== Simulate the two items in the spreadsheet for dim_Spell.
-- This is not a part of the solution.
-- We're just setting up a partial demo here.
SELECT dsp_gueltig_von = CONVERT(DATE,v.dsp_gueltig_von)
,dsp_gueltig_bis = CONVERT(DATE,v.dsp_gueltig_bis)
INTO #dim_Spell
FROM (VALUEs
('27.12.19','02.01.20')
,('29.12.19','04.01.20')
)v(dsp_gueltig_von,dsp_gueltig_bis)
;
--===== Solution
-- Get the fnTally function from the article at the similarly named link in my
-- siganture line below. You really need one in your database for a whole lot more
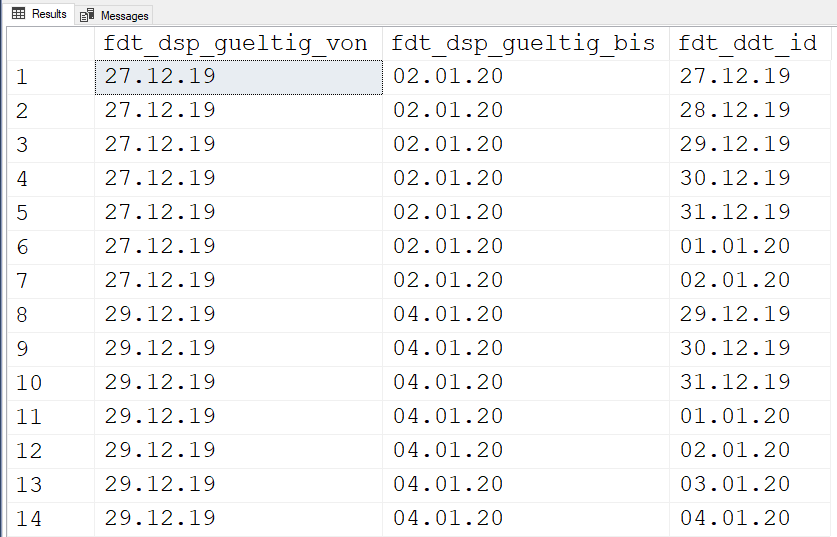
SELECT fdt_dsp_gueltig_von = CONVERT(CHAR(8),dsp.dsp_gueltig_von,4)
,fdt_dsp_gueltig_bis = CONVERT(CHAR(8),dsp.dsp_gueltig_bis,4)
,fdt_ddt_id = CONVERT(CHAR(8),DATEADD(dd,t.N,dsp.dsp_gueltig_von),4)
FROM #dim_Spell dsp
CROSS APPLY dbo.fnTally(0,DATEDIFF(dd,dsp.dsp_gueltig_von,dsp.dsp_gueltig_bis))t
;Results:
--Jeff Moden
RBAR is pronounced "ree-bar" and is a "Modenism" for Row-By-Agonizing-Row.
First step towards the paradigm shift of writing Set Based code:
________Stop thinking about what you want to do to a ROW... think, instead, of what you want to do to a COLUMN.Change is inevitable... Change for the better is not.
Helpful Links:
How to post code problems
How to Post Performance Problems
Create a Tally Function (fnTally) -
Jeff - I do believe that the sample supplied with 2 digits and "." as separator is only how its displayed and not how its stored.
-
Hi Jeff,
the translation worked :-). I will test it on the large data set right away. The date format is just Excel being Excel where I prepared the demo. I use DATE data type in MSSQL.
But I wanted to comment on your and frederico_fonseca's thoughts.
Why have I chosen that path?
Well, first, the reporting/analysis tool we use is not MOLAP based like SSAS (I know SSAS supports ROLAP/HOLAP) but ROLAP (MicroStrategy). Second, the use cases always focus on the level of the fact table itself (transaction level) but no aggregates out of it. MicroStratey (ignoring the fact that it comes with an analytical engine extending the SQL standard) is a meta data layer with a SQL query generator in the backend. I made seveal tests with SSAS in the first place to get transaction data out of a ROLAP setup but it didn't work. The queries have been very slow and there was no way to store the result set in a table with Management Studio or other tools (DAX Studio did the best of it). There is also no MDX/DAX expertise available where I work. Before thinking going to MicroStratey, I started a thread in this forum in the beginning how to get transaction level data out of SSAS (https://www.sqlservercentral.com/forums/topic/ssas-rolap-to-work-to-query-low-level-data-for-large-data-sets-with-mdx)
The last argument is another performance driven test I did. Instead of multiplication of dates I first started to filter the time series data with "between" or "<="/">=". I benchmarked it with large data sets (1bn records) to get point in time data and JOIN based approach with fact_Datum did a much better job (3-5,3x faster than between)
So, that is why I ended up with that factless fact table. The uncompressed table with 10bn records is about 180GB in size, I use column store to get it down to 11GB which is nice.
But this discussion is exactly I was hoping for. That is why I wrote the huge intro to get different ideas how to handle the use case instead of just starting with the puzzle itself.
-
using columnstore is potentially one of your other issues - while it is GREAT for space saving and for aggregation style SQL it can perform badly for plain joins to extract data.
I was looking at your other thread and I wonder how will your "users" query the data if you give them a csv file with 5 million rows - what tool will they use to process the file and give them the option to process it and allow them to work with the data.
regarding using SSIS to write to a table - have a look at this video https://www.youtube.com/watch?v=AoZyljBdU_I - but do be aware that while it is "easy" to extract building the cube itself and its measures is where the hard part is - and to do the processing of the dates as you need would require a bit of DAX/MDX expertise.
- svenflock wrote:
Hi Jeff,
the translation worked :-). I will test it on the large data set right away. The date format is just Excel being Excel where I prepared the demo. I use DATE data type in MSSQL.
But I wanted to comment on your and frederico_fonseca's thoughts.
Why have I chosen that path?
Well, first, the reporting/analysis tool we use is not MOLAP based like SSAS (I know SSAS supports ROLAP/HOLAP) but ROLAP (MicroStrategy). Second, the use cases always focus on the level of the fact table itself (transaction level) but no aggregates out of it. MicroStratey (ignoring the fact that it comes with an analytical engine extending the SQL standard) is a meta data layer with a SQL query generator in the backend. I made seveal tests with SSAS in the first place to get transaction data out of a ROLAP setup but it didn't work. The queries have been very slow and there was no way to store the result set in a table with Management Studio or other tools (DAX Studio did the best of it). There is also no MDX/DAX expertise available where I work. Before thinking going to MicroStratey, I started a thread in this forum in the beginning how to get transaction level data out of SSAS (https://www.sqlservercentral.com/forums/topic/ssas-rolap-to-work-to-query-low-level-data-for-large-data-sets-with-mdx)
The last argument is another performance driven test I did. Instead of multiplication of dates I first started to filter the time series data with "between" or "<="/">=". I benchmarked it with large data sets (1bn records) to get point in time data and JOIN based approach with fact_Datum did a much better job (3-5,3x faster than between)
So, that is why I ended up with that factless fact table. The uncompressed table with 10bn records is about 180GB in size, I use column store to get it down to 11GB which is nice.
But this discussion is exactly I was hoping for. That is why I wrote the huge intro to get different ideas how to handle the use case instead of just starting with the puzzle itself.
On the date format thing for the screen shot, you can remove the "CONVERTs" from the SOLUTION part of that code if that's all it was. It'll make things even faster.
As you indicated, I'm still a big fan of just using the von and bis dates in a WHERE clause.
As a bit of a sidebar, I've not used ColumnStore "in anger" yet, but I have to agree with Frederico... it's not so hot when it comes to Joins. It may be better to extract the data you want using the von and bis dates and then use that extraction to drive you other stuff.
As for SSAS and MDX, let's just say that I consider that to be a four letter word in SQL and have been successful in producing some incredible analytic abilities using normal tables and good ol' T-SQL. 😉
--Jeff Moden
RBAR is pronounced "ree-bar" and is a "Modenism" for Row-By-Agonizing-Row.
First step towards the paradigm shift of writing Set Based code:
________Stop thinking about what you want to do to a ROW... think, instead, of what you want to do to a COLUMN.Change is inevitable... Change for the better is not.
Helpful Links:
How to post code problems
How to Post Performance Problems
Create a Tally Function (fnTally) -
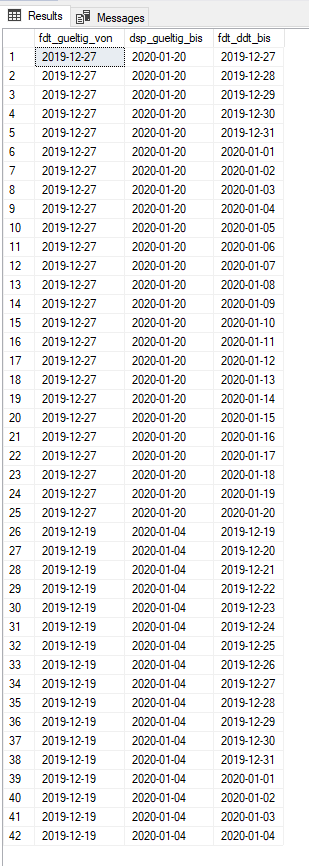
If you install this function: https://www.sqlservercentral.com/scripts/a-daterange-table-valued-function
You can then run this code:
;WITH CTE as
(
    SELECT *
      FROM (VALUES (CONVERT(date,'20191227'),CONVERT(date,'20200120')),
                   ('20191219','20200104')) T(StartDate,EndDate)

)
SELECT x.StartDate  fdt_gueltig_von,
       x.EndDate    dsp_gueltig_bis,
       convert(date, d.Value) fdt_ddt_bis
  FROM CTE x
 CROSS APPLY dbo.DateRange(x.StartDate,x.EndDate,'dd',1) d
Which will return this:
-
Hi all,
thanks for all your input. The tally function did the trick. Though, I had to split it up on a yearly basis to get it finished in about an hour. Without the partition focused processing it wasn't finished after 3 hours. I don't understand, why it doesn't scale in a linear matter as it not a n^2 problem. Maybe it's an issue with memory on SQL Server 2016 as the allocated query buffer cannot be changed during run time as in later versions.
TRUNCATE TABLE zugriff.fact_datum

DECLARE @cutOff  DATE = '2020-04-20' ,
        @cnt     INT  = 2            ,
        @cntDiff INT  = 0
        ;

SET @cntDiff = Year(@cutOff) - 1968

WHILE @cnt <= @cntDiff
BEGIN
  PRINT 'Processing year ' + Cast(1968 + @cnt AS CHAR(255));

  INSERT INTO zugriff.fact_datum WITH (tablock)
  SELECT      Dateadd(dd, t.n, dsp.dsp_gueltig_von),
              dsp.dsp_gueltig_von,
              dsp.dsp_gueltig_bis
  FROM        zugriff.dim_spell dsp

  CROSS apply dbo.Fntally(0, Datediff(dd, dsp.dsp_gueltig_von, dsp.dsp_gueltig_bis) ) t

  WHERE       $partition.Partitioningbydate(dsp.dsp_gueltig_von) = @cnt OPTION(use hint('ENABLE_PARALLEL_PLAN_PREFERENCE'))

  SET @cnt = @cnt + 1;
END;
The CSV export was just an idea in the other threat. MicroStrategy now stores the result in a MS SQL table and can be processed further by the data scientists.
The other reason for the factless fact table is that in MicroStrategy the user can just pick a date to filter the records point in time. This would be not possible working with between-like operators as MicroStrategy does not translate a single date into such required query.
Jeff: nice way to express the analytical language extensions of MS :-).
About column store: I ran into that problem with joins on that storage type. Currently, I counteract that behaviour by adding an index with the relevant columns for the join and use a query hint to use that index. Not an ideal solution, but I have the best of both worlds, i.e. nice storage and super fast query performance of a single attribute but also a good performance for joins.
-
How many von/bis dates are you feeding this thing from the zugriff.dim_spell table? And how much (or little) memory do you have available on the SQL Server?
Also, I wish I had a deeper knowledge of the MicroStrategy system and what it is you're trying to pull off. I have to admit that I've not done a deep study on your original post, though.
--Jeff Moden
RBAR is pronounced "ree-bar" and is a "Modenism" for Row-By-Agonizing-Row.
First step towards the paradigm shift of writing Set Based code:
________Stop thinking about what you want to do to a ROW... think, instead, of what you want to do to a COLUMN.Change is inevitable... Change for the better is not.
Helpful Links:
How to post code problems
How to Post Performance Problems
Create a Tally Function (fnTally) -
Hi Jeff,
maybe I can help you out with MicroStrategy a little bit. End users are business analysts with an high level of knowledge of the underlying data but not with data modelling in particular, i.e. they don't know Kimball or Business Vault techniques. So, MicroStratey hides the data model and makes all attributes and metrics visible to the end user. It's like a powerful Pivot table in Excel. The user knows what fields are attributes and metrics. Further, he is guided with pre-poulated lists.
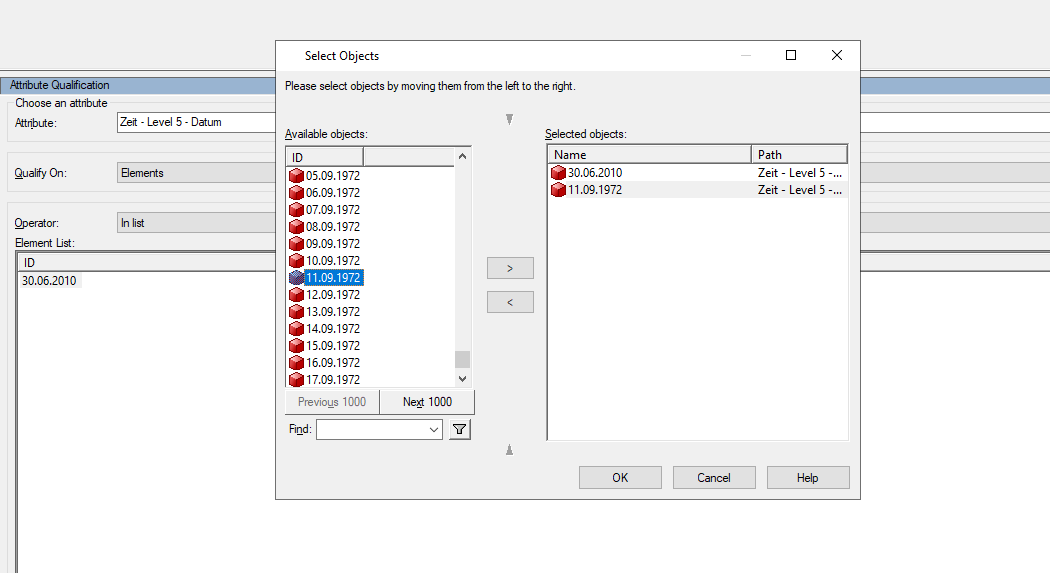
In case of point in time queries, the user just takes the date attribute and drags it to the filter - the most intuitive way. Here is a screenshot how it looks like:
As the user doesn't know the underlying model, the user would know how to limit the data to that. So, MicroStrategy does the job for you. It generates the following query to filter dimensions and facts point-in-time, e.g. what customers have been active to a given time:
Job: 888
Report Cache Used: No

Number of Columns Returned: 1
Number of Temp Tables:                             0

Total Number of Passes:          1
Number of SQL Passes:            1
Number of Analytical Passes:     0

Tables Accessed:
dim_XYZ
fact_ABC
fact_Datum


SQL Statements:
select    distinct [a11].[dvr_cust_id]    [cust_id]
from      [zugriff].[dim_XYZ]                 [a11]
                join        [zugriff].[fact_ABC]        [a12]
                  on        ([a11].[dvr_id] = [a12].[fba_dvr_id])
                join        [zugriff].[fact_Datum]   [a13]
                  on        ([a12].[fba_met_spell_gueltig_bis] = [a13].[fdt_dsp_gueltig_bis]
                 and        a12].[fba_met_spell_gueltig_von] = [a13].[fdt_dsp_gueltig_von])
where  [a13].[fdt_ddt_id] in ('2010-06-30')


[Analytical engine calculation steps:
                1.  Perform cross-tabbing
]
Because MicroStratey links objects by columns, joins are the only way to implement such filter in an easy way.
Hope that it clarifies my requirements a bit.
Viewing 15 posts - 1 through 15 (of 16 total)
You must be logged in to reply to this topic. Login to reply