Good query plan gone bad - can I pinpoint a cause with no repro?
-
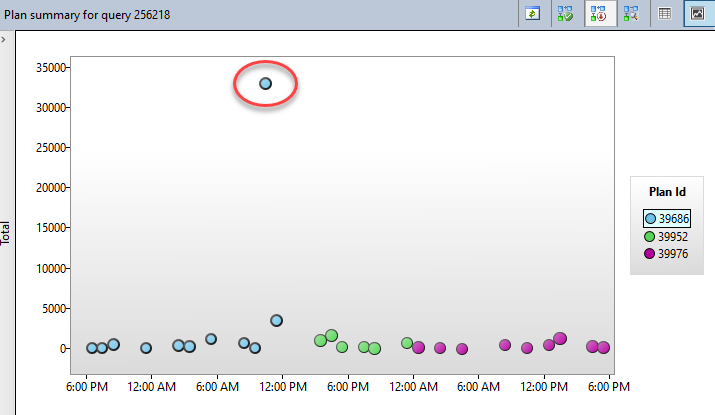
In an Azure SQL Database, we have a heavily parameterized search stored procedure that joins 15-20 tables and has probably 20+ WHERE conditions. Still, it almost always runs in < 500 ms. Then for some unknown reason, execution time suddenly spikes to 6, 15, 70+ seconds for an extended period of time. It doesn't correspond to high usage, DTU limits/throttling, and doesn't seem to be resource contention(?), nor does it correlate with underlying data changes (haven't fully ruled that out, nor statistics, but would statistics have a negative impact as drastic as this?):

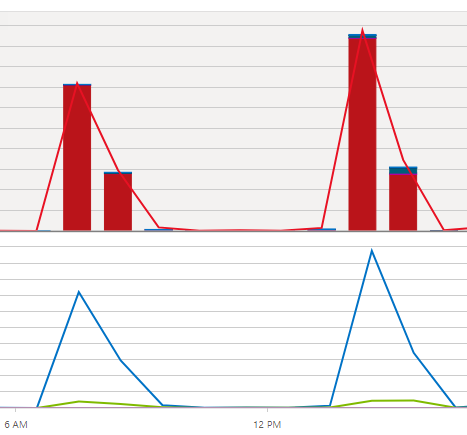
On some occasions, again all under the same execution plan, poor performance occurs across spans of 1-2 hours interspersed with good performance (12-hour resource usage of this one query below...couldn't overlay query counts ):
I saw a missing index in one of the plans, and was encouraged by Microsoft support to turn on the automatic tuning CREATE INDEX feature, which also recommended that index and is validating it and a couple of other new ones now. Still, what I want to know is how to identify the true culprit (via Query Store or other logged data?) behind these rare periods of bad performance under a previously solid execution plan. I can't reproduce the problem, and all I'm being given are ways to try to prevent it in the future and monitor in case it happens again... any thoughts? Not on tuning, but troubleshooting?
I'm attaching one of the plans that's been known to have experienced bad performance in the last month (and it does note a missing index, which...maybe has only been impactful sometimes?), and another that hasn't.
-
Zipping the plans and trying again.
-
You say "On some occasions, again all under the same execution plan, poor performance occurs " but the execution plans you posted aren't even close to being the same.
The culprit here may be that the "good" plan was forced out of plan cache and when a new plan was made, it created a "bad" plan.
To answer your question, yes... statistics could absolutely be the problem here. And, it may not correlate with your larger data changes at all. It very well could be that the larger changes didn't quite "go over the edge" to cause an automatic update of statistics but a smaller data change may be the proverbial straw that breaks the camel's back and causes a statistics update, which would also force the code to recompile the next time it's executed and it would come up with a better plan because of the updated statistics.
I don't know if Azure allows you to lock in a known good plan like you can in SQL Server (I forget what that's called because I don't use it) but I probably wouldn't do that. I also wouldn't have a single stored procedure that joins so many tables. Instead, I'd break it down into smaller tasks making sure to identify the "core" (minimal possible set) that would drive all the other pieces and store it in a Temp Table.
I can tell you the process of "Divide'n'Conquer" can really work a treat. One company that I was contracted to work for asked me to setup a clone of a rather large system so they could do year end reporting. The funny thing is, they only needed to run one query. The reason why they wanted the clone was because the query would run for about 8 hours and bring the server to its knees rendering the server all but useless to anyone else (it drove temp db to the wall and it grew from a couple of gig to more than 500gig according to them)
I wasn't familiar with the data at all and so it took me a good hour or more to figure out what the "core" of the query was and then another couple of hours to get the rest of the stuff right but, the end result was a query that ran in less than 3 seconds and barely made a blip on the performance monitors.
The report was incredibly useful to them but they only ran it once per year because it crushed the server every time it was running. After I got it down under the 3 second mark (and super small amounts of Temp Table usage), they started using it every week and the info from the report save them a ton of time every week.
Yep... it'll take some work to determine what the "core" is for a query like this (and, there may actually be more than one "core") and it'll take a while to put things back together but, OMG, it's worth it.
Or, you could lock in the good execution plan and call it "done"... until that breaks and then do it again. And maybe again, and again again. 😀
--Jeff Moden
RBAR is pronounced "ree-bar" and is a "Modenism" for Row-By-Agonizing-Row.
First step towards the paradigm shift of writing Set Based code:
________Stop thinking about what you want to do to a ROW... think, instead, of what you want to do to a COLUMN.Change is inevitable... Change for the better is not.
Helpful Links:
How to post code problems
How to Post Performance Problems
Create a Tally Function (fnTally) -
p.s. If there's a DISTINCT or a GROUP BY that you're using like a DISTINCT, you really need to fix that. Really. And identifying the "core" data and using "Divide'n'Conquer" will likely completely eliminate that problem altogether.
--Jeff Moden
RBAR is pronounced "ree-bar" and is a "Modenism" for Row-By-Agonizing-Row.
First step towards the paradigm shift of writing Set Based code:
________Stop thinking about what you want to do to a ROW... think, instead, of what you want to do to a COLUMN.Change is inevitable... Change for the better is not.
Helpful Links:
How to post code problems
How to Post Performance Problems
Create a Tally Function (fnTally) -
Jeff has nailed the answer. I just want to add that, yes, in Azure you can use Plan Forcing to ensure that a given plan gets used. It's part of the Query Store, enabled by default in Azure SQL Database.
For what it's worth, the automated performance tuning can, sometimes, when the wind is blowing from the right quarter, and you're lucky, do this for you.
"The credit belongs to the man who is actually in the arena, whose face is marred by dust and sweat and blood"
- Theodore RooseveltAuthor of:
SQL Server Execution Plans
SQL Server Query Performance Tuning -
This is not an uncommon issue with a search procedure. The fact that you are getting good performance most of the time is great.
As a first step, I would attempt to determine, over time, what the most common set of parameters may be that are used in the query. Tune for those parameters.
For whatever parameters or combination of parameters are not common, I would use dynamic SQL to execute the query.
You may need three procedures.
The first gets called, and tests for the most common parameters. It then calls either the dynamic procedure or the tuned procedure based upon the parameters.
I'm betting that there are a number of patterns in the WHERE clause like this:
WHERE ((Column = @Parm) OR @pam IS NULL)
Michael L John
If you assassinate a DBA, would you pull a trigger?
To properly post on a forum:
http://www.sqlservercentral.com/articles/61537/ -
Yes, the query looks exactly like you mentioned, Michael. I like the idea of splitting by usage scenarios, especially where there seem to be a couple of the more obscure search filters that happen to be a fair bit more expensive.
Here's the thing: I've heard a few good suggestions for query tuning, which is great, but at this point I'm still researching the past...what I want to know is whether there is any way I can discover what actual parameter values were passed in during the poor performance. I realize that I can set up XEvent sessions, etc., going forward, but no special logging or monitoring was going on when this started.
If I have some known time ranges and query plan IDs, is there anywhere that I can get metadata on specific (stored procedure) query executions...i.e. any metrics about their execution time along with the parameters that were passed in? Obviously Query Store has at least some aggregate data that it uses...how detailed is it, and how can I get it?
-
Sorry for the confusion, Jeff...that's partly why I wanted to include the graph of the plan performance but I didn't explain well. The "bad" plan I uploaded was the one in the graph that was chugging along happily for days, and ended with the poor performance. I believe someone explicitly removed it. Most of the plans over the last couple of months that have tanked in performance have been versions of that plan, at first glance. The "good" plan seems to be representative of the ones that have never encountered any poor performance, and would most likely be the one we would force.
Just for investigative purposes (since we can't reproduce the problem), do you know if, for example, we can look up any logged Query Store metadata about individual query executions (that is logged by default), including what parameter values were passed in for an actual stored procedure call, execution times, etc.? I know how to collect these on demand via XEvents, just wondering if any of it is system-logged and available.
- coryseaman wrote:
Yes, the query looks exactly like you mentioned, Michael. I like the idea of splitting by usage scenarios, especially where there seem to be a couple of the more obscure search filters that happen to be a fair bit more expensive.
Here's the thing: I've heard a few good suggestions for query tuning, which is great, but at this point I'm still researching the past...what I want to know is whether there is any way I can discover what actual parameter values were passed in during the poor performance. I realize that I can set up XEvent sessions, etc., going forward, but no special logging or monitoring was going on when this started.
If I have some known time ranges and query plan IDs, is there anywhere that I can get metadata on specific (stored procedure) query executions...i.e. any metrics about their execution time along with the parameters that were passed in? Obviously Query Store has at least some aggregate data that it uses...how detailed is it, and how can I get it?
Simple way to do this is to create a table with columns that match the parameters. Add an identity, created time, and completed time columns. Insert the values of the parms in the table at the start of the proc, capture the new identity, and at the end of the proc update the completed time with the date/time.
Michael L John
If you assassinate a DBA, would you pull a trigger?
To properly post on a forum:
http://www.sqlservercentral.com/articles/61537/ - coryseaman wrote:
Sorry for the confusion, Jeff...that's partly why I wanted to include the graph of the plan performance but I didn't explain well. The "bad" plan I uploaded was the one in the graph that was chugging along happily for days, and ended with the poor performance. I believe someone explicitly removed it. Most of the plans over the last couple of months that have tanked in performance have been versions of that plan, at first glance. The "good" plan seems to be representative of the ones that have never encountered any poor performance, and would most likely be the one we would force.
Just for investigative purposes (since we can't reproduce the problem), do you know if, for example, we can look up any logged Query Store metadata about individual query executions (that is logged by default), including what parameter values were passed in for an actual stored procedure call, execution times, etc.? I know how to collect these on demand via XEvents, just wondering if any of it is system-logged and available.
Unfortunately, I'm not the right person to ask about Query Store. I've not yet used it and need to study it a bit. Heh... I always like to know what I'm doing with something before I do something with it, especially any caveats, gotcha's, and oolies.
--Jeff Moden
RBAR is pronounced "ree-bar" and is a "Modenism" for Row-By-Agonizing-Row.
First step towards the paradigm shift of writing Set Based code:
________Stop thinking about what you want to do to a ROW... think, instead, of what you want to do to a COLUMN.Change is inevitable... Change for the better is not.
Helpful Links:
How to post code problems
How to Post Performance Problems
Create a Tally Function (fnTally) - coryseaman wrote:
Yes, the query looks exactly like you mentioned, Michael. I like the idea of splitting by usage scenarios, especially where there seem to be a couple of the more obscure search filters that happen to be a fair bit more expensive.
Here's the thing: I've heard a few good suggestions for query tuning, which is great, but at this point I'm still researching the past...what I want to know is whether there is any way I can discover what actual parameter values were passed in during the poor performance. I realize that I can set up XEvent sessions, etc., going forward, but no special logging or monitoring was going on when this started.
If I have some known time ranges and query plan IDs, is there anywhere that I can get metadata on specific (stored procedure) query executions...i.e. any metrics about their execution time along with the parameters that were passed in? Obviously Query Store has at least some aggregate data that it uses...how detailed is it, and how can I get it?
You can look at the execution plan properties. They're in the first operator, the SELECT/UPDATE/INSERT/DELETE, all the way on the left of the plan. In the properties, you'll see the parameter compile time values. They're stored with the plan.
"The credit belongs to the man who is actually in the arena, whose face is marred by dust and sweat and blood"
- Theodore RooseveltAuthor of:
SQL Server Execution Plans
SQL Server Query Performance Tuning
Viewing 11 posts - 1 through 11 (of 11 total)
You must be logged in to reply to this topic. Login to reply